
Figure 2.
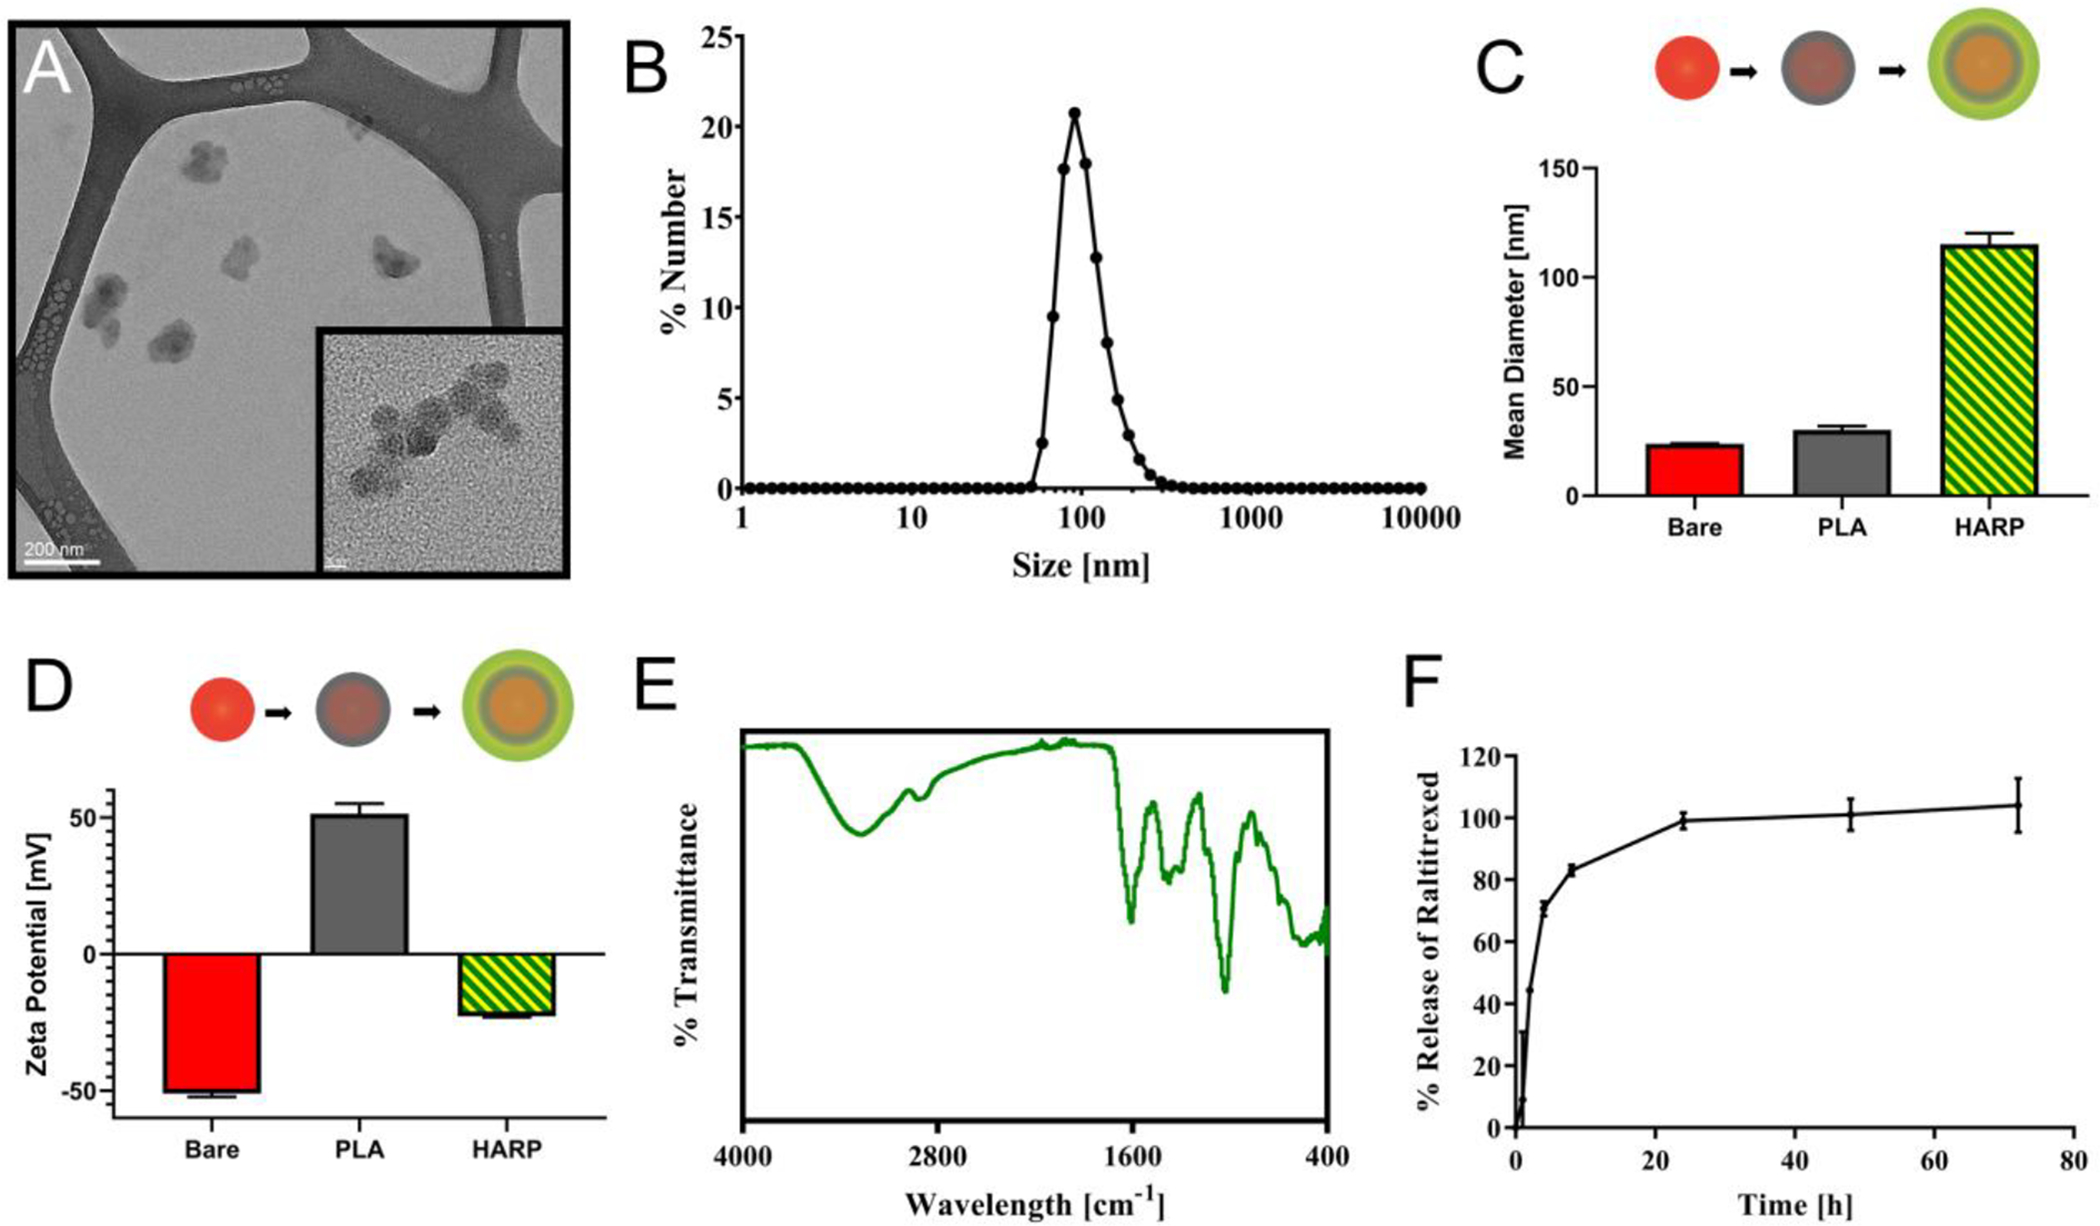
Physiochemical properties of the HARPs platform. (A) Transmission electron micrograph of the HARPs. Lower magnification scale = 200 nm, higher magnification scale = 20 nm. (B) Size distribution by number of the final HARP formulation centered ~100 nm. (C) Mean diameter at each deposition stage shows small size increase with PLA deposition and larger increase with HA/RTX deposition. (D) Zeta potential at each deposition stage. (E) IR spectrum of the HARPs. (F) Release of RTX from the HARPs over 72 hours in pH 7.4 PBS at room temperature.