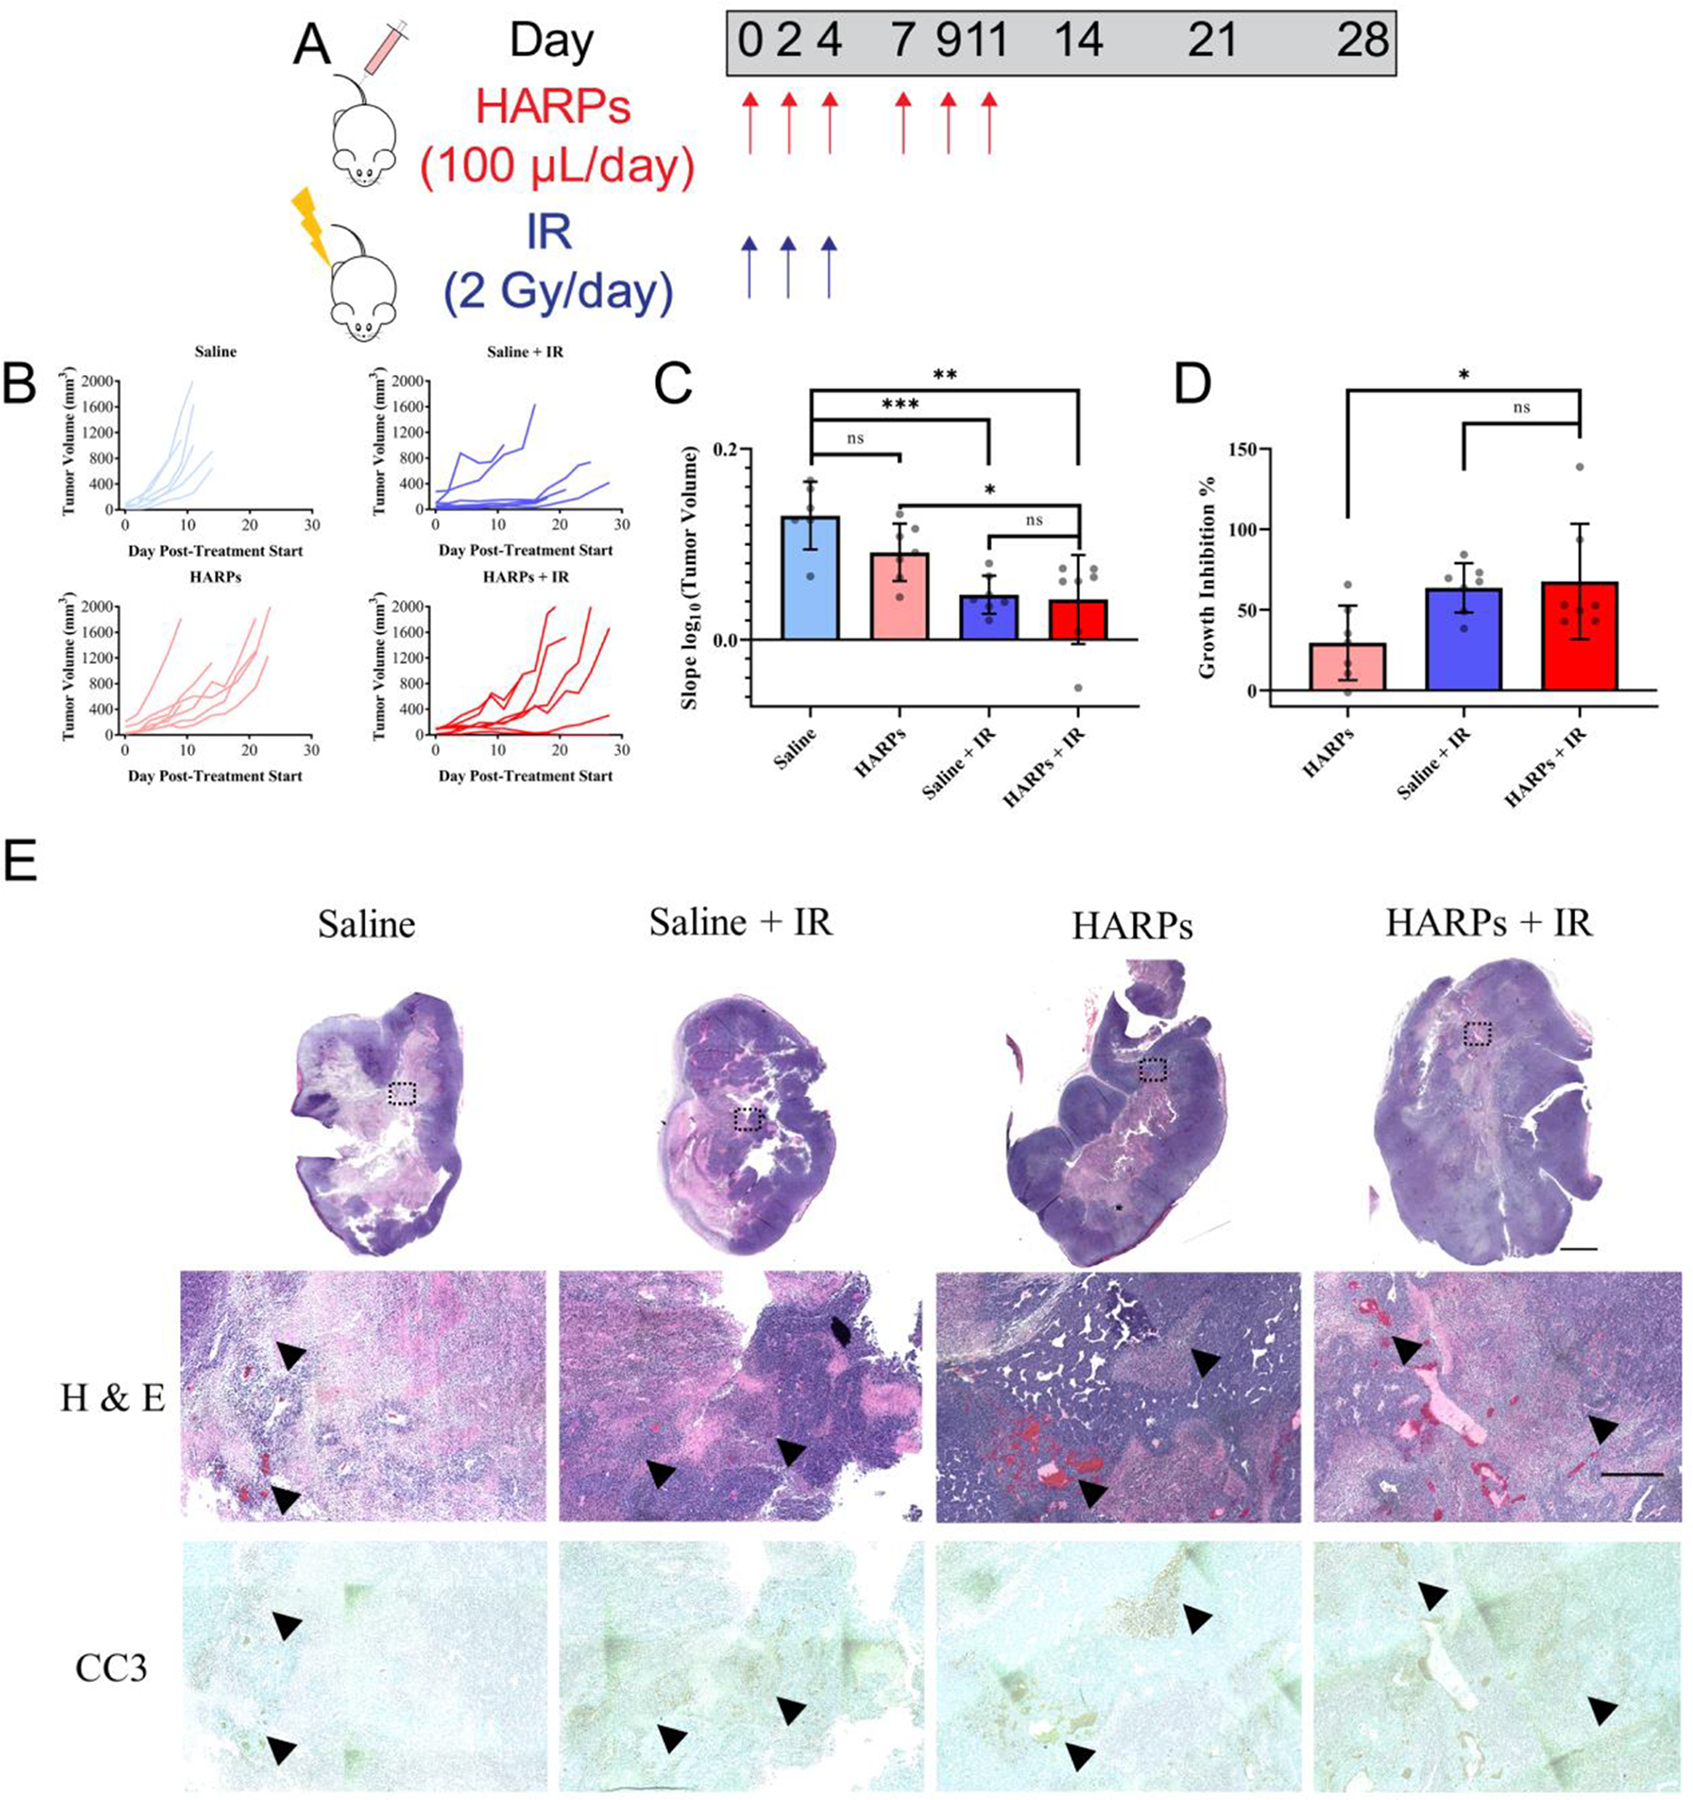
Figure 5.

Tumor treatment schedule and outcomes. (A) Schematic showing dosing schedule for both saline/HARPs and IR. (B) Individual tumor growth curves for each animal divided into treatment groups. (C) Slope of logarithmic converted tumor volumes, or “tumor growth rate”, for each treatment group presented as mean ± standard deviation. (D) Growth rate inhibition for each treatment group (relative to saline alone control) presented as mean ± standard deviation. Data significance evaluated with unpaired student t-test, *, P < 0.05, **, P < 0.01, ***, P < 0.001. (E) Images of histology slides highlighting necrotic/apoptotic regions in tumors excised from various treatment groups 21 days after initiating treatment. Low magnification scale bar indicates 2 mm; high magnification scale bar indicates 500 μm.
