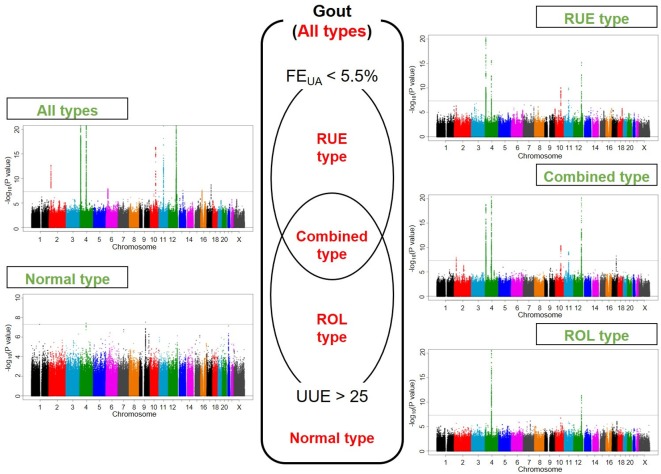
Figure 1.
Manhattan plots of GWASs of subtypes of gout. Clinical subtypes and Manhattan plots of GWASs of all gout types, RUE type gout, combined type gout, ROL type gout and normal type gout are shown. The x-axis represents chromosomal positions and the y-axis shows −log10 p values. The dotted lines indicate the genome-wide significance threshold (p=5.0×10⁻⁸). FEUA, fractional excretion of uric acid (%); GWASs, genome-wide association studies; ROL, renal overload; RUE, renal underexcretion; UUE, urinary urate excretion (mg/h/1.73 m2). See table 1 and online supplementary figure S1 for a detailed classification of gout/hyperuricaemia.

