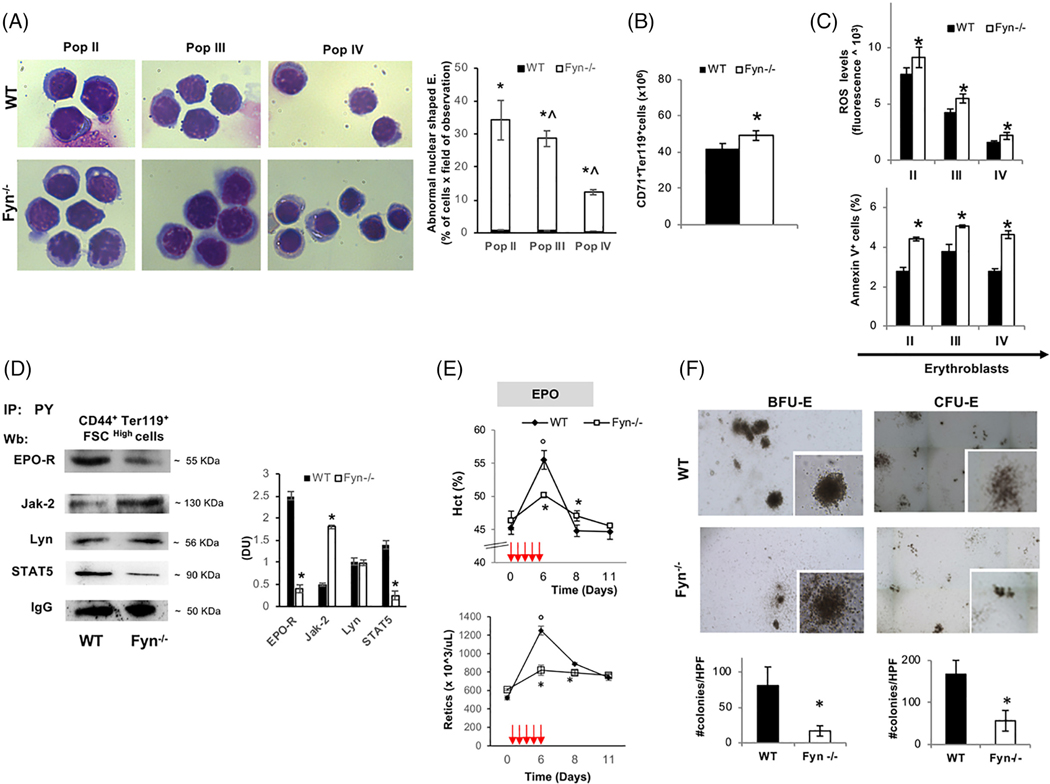
FIGURE 1.
The absence of Fyn results in perturbation of EPO signaling cascade. A, Left panel. Morphology of sorted erythroid precursors: population II (pop II), corresponding to basophilic erythroblasts; population III (pop III), corresponding to polychromatic erythroblasts and population IV (pop IV), corresponding to orthochromatic erythroblasts, from bone marrow of wild-type (WT) and Fyn−/− mice. Cytospins were stained with may-Grunwald-Giemsa. One representative image from a total of 10 for each mouse strains. Right panel. Abnormal nuclear shaped erythroblasts and binuclear erythroblasts from WT and Fyn−/− mice evaluated on cytospin stained with may-Grunwald-Giemsa. Data are presented as means ±SD (n = 8 from each strain); *P < .05 compared to WT; ^P < .05 compared to pop II−. B, Cyto-fluorimetric analysis of total erythroid precursors from the bone marrow of WT and Fyn−/− mice using the following surface markers: CD71 and Ter119 (see also the Supporting Information Materials and Methods and Figure 2Sa for maturation profile). Data are presented as means ±SD (n = 8); * P < .05 compared to WT. C, Upper panel: ROS levels in erythroid precursors from bone marrow of wild-type (WT) and Fyn−/− mice. Data are presented as means ±SD (n = 10 from each strain); * P < .05 compared to WT. Lower panel: Amount of Annexin V+ cells in pop II, III, and IV from bone marrow of WT and Fyn−/− mice. Data are presented as means ±SD (n = 8 from each strain); * P < .05 compared to WT. D, Total Tyrosin-(Tyr) phosphorylated proteins were immunoprecipitated from 2.5 ^106 bone marrow sorted erythroblasts of WT and Fyn−/− mice and detected with antibody to EPO- receptor (EPO-R), Janus kinase-2 (Jak-2), Lyn kinase (Lyn), signal transducer and activator of transcription 5 (STAT5). The experiment shown is representative of six such experiments. IgG was used as loading control. Right panel: Densitometric analyses of the immunoblot bands similar to those shown are presented at right (DU: Densitometric unit). Data are shown as means ±SD (n = 6; *P < .01 compared to WT). E, Hematocrit (%) and reticulocyte count in (n = 6) and Fyn−/− (n = 6) mice exposed to recombinant erythropoietin injection (EPO 50 U/kg/die, red arrows). Data are presented as means ±SD; *P < .05 compared to WT mice; °P < .05 compared to baseline values. F, The CFU-E and BFU-E from WT and Fyn−/− mice were quantified (#CFU-E or BFU-E/dish; lower panel); data are shown as means ±SD (n = 6; P < .05 compared to WT)

