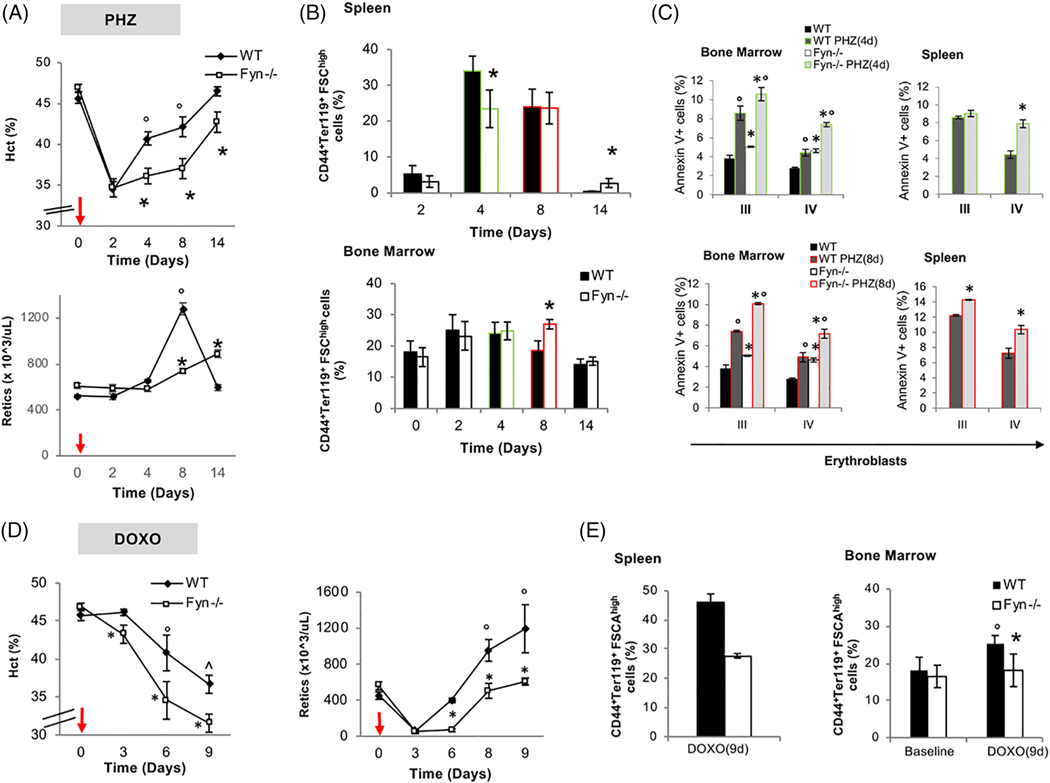
FIGURE 2.
A blunted response to stress erythropoiesis characterizes Fyn−/− mice. A, Hematocrit (%) and reticulocyte count in WT (n = 6) and Fyn−/− (n = 6) mice exposed to phenylhydrazine injection (PHZ/kg/die, red arrows). Data are presented as means ±SD; *P < .05 compared to WT mice; °P < .05 compared to baseline values. B, Cyto-fluorimetric analysis of total erythroid precursors from the bone marrow and the spleen of WT and Fyn−/− mice using the following surface markers: CD44 and Ter119 (see also the Supporting Information and Methods and Figure 3Sa for absolute values). Data are presented as means ±SD (n = 6); * P < .05 compared to WT. since we focus on day 4 and day 8 after PHZ administration, we highlighted them respectively in green and red. This color code is used also in C. C, Amount of Annexin-V+ cells in population III (pop III), corresponding to polychromatic erythroblasts and population IV (pop IV), corresponding to orthochromatic erythroblasts from either spleen or bone marrow of WT and Fyn−/− mice respectively at 4 (green) and 8 (red) days after PHZ administration. Data are presented as means ±SD (n = 6 from each strain); *P < .05 compared to WT. D, Hematocrit (%) and reticulocyte count in WT (n = 6) and Fyn−/− (n = 6) mice exposed to doxorubicin injection (DOXO 0,25 mg/kg/die, red arrows). Data are presented as means ±SD; *P < .05 compared to WT mice; P < .05 compared to baseline values. E, Cyto-fluorimetric analysis of total erythroid precursors from the bone marrow and the spleen of WT and Fyn−/− mice using the following surface markers: CD44 and Ter119 (see also the Supporting Information and Methods and Figure 3Sb for absolute values) 9 days after doxorubicin injection. Data are presented as means ± SD (n = 6); * P < .05 compared to WT; P < .05 compared to baseline values

