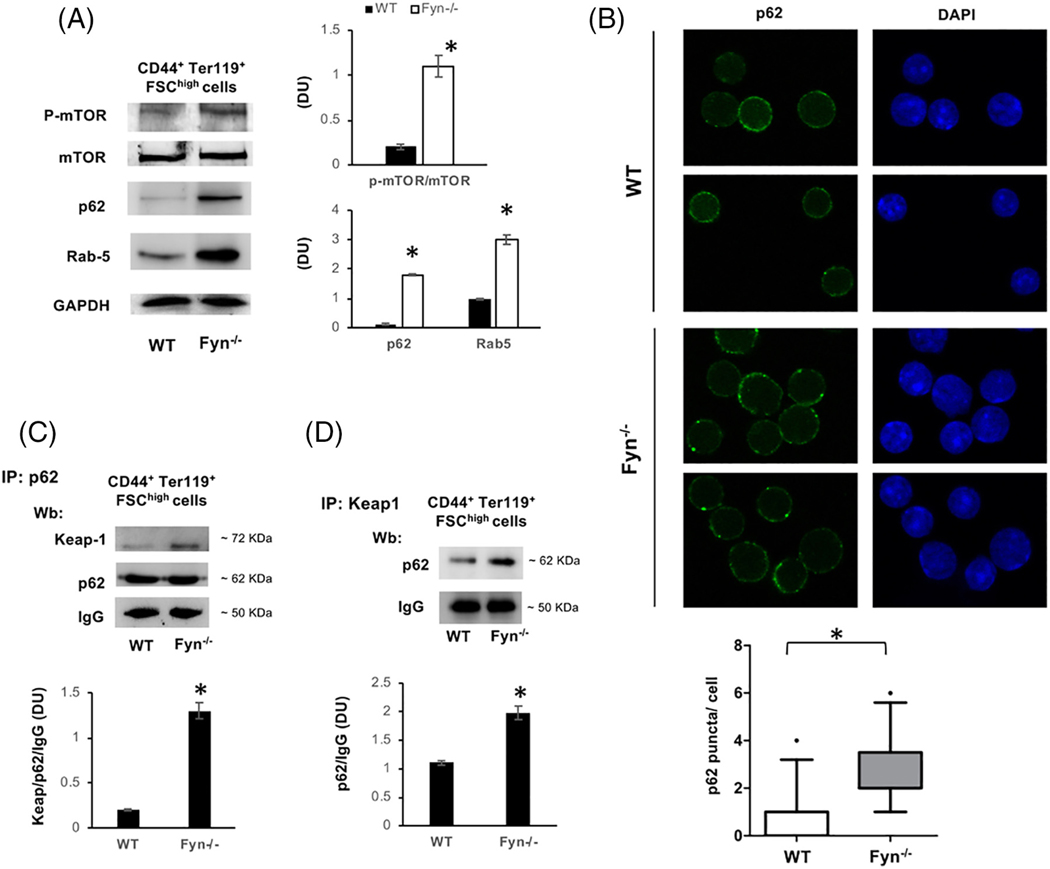
FIGURE 3.
Activation of mTOR and impaired autophagy characterize Fyn−/− mouse erythroblasts. A, Western-blot (Wb) analysis of phospho-mTOR (p-mTOR), m-TOR, p62 and Rab 5 in sorted 1.5 ^106 CD44+Ter119+FSCHigh bone marrow cells from WT (n = 4) and Fyn−/− mice. GAPDH was used as protein loading control. Densitometric analyses of the immunoblot bands similar to those shown are presented at right (DU: Densitometric unit). Data are shown as means ±SD (n = 4; *P < .01 compared to WT). B, p62 immunostained cytospin preparations of sorted CD44+Ter119+FSCHigh bone marrow cells from WT and Fyn−/− mice counterstained with DAPI. Lower panel: The puncta mean fluorescence was measured using image J software. Data are presented as means ±SD (n = 3); *P < .05 compared to WT. C, Immunoprecipitates (IP) containing equal amounts of p62 were obtained from 2.5 ^106 sorted CD44+Ter119+FSCHigh bone marrow cells from WT and Fyn−/− mice, then subjected to immunoblot with anti-Keap1 or p62 antibody (Wb: Western-blot). The experimental results shown are representative of four similar separate experiments. IgG was used as loading control.Densitometric analyses of the immunoblot bands similar to those shown are presented at lower panel (DU). Data are shown as means ±SD (n = 4; *P < .01 compared to WT). D, IP of Keap 1 were obtained from sorted 2.5 ^106 CD44+Ter119+FSChigh bone marrow cells from WT and Fyn−/− mice, then subjected to immunoblot with anti- p62 antibody (Wb: Western-blot). The experimental results shown are representative of 4 similar separate experiments. IgG was used as loading control. Densitometric analyses of the immunoblot bands similar to those shown are presented at lower panel (DU). Data are shown as means ±SD (n = 4; *P < .01 compared to WT)

