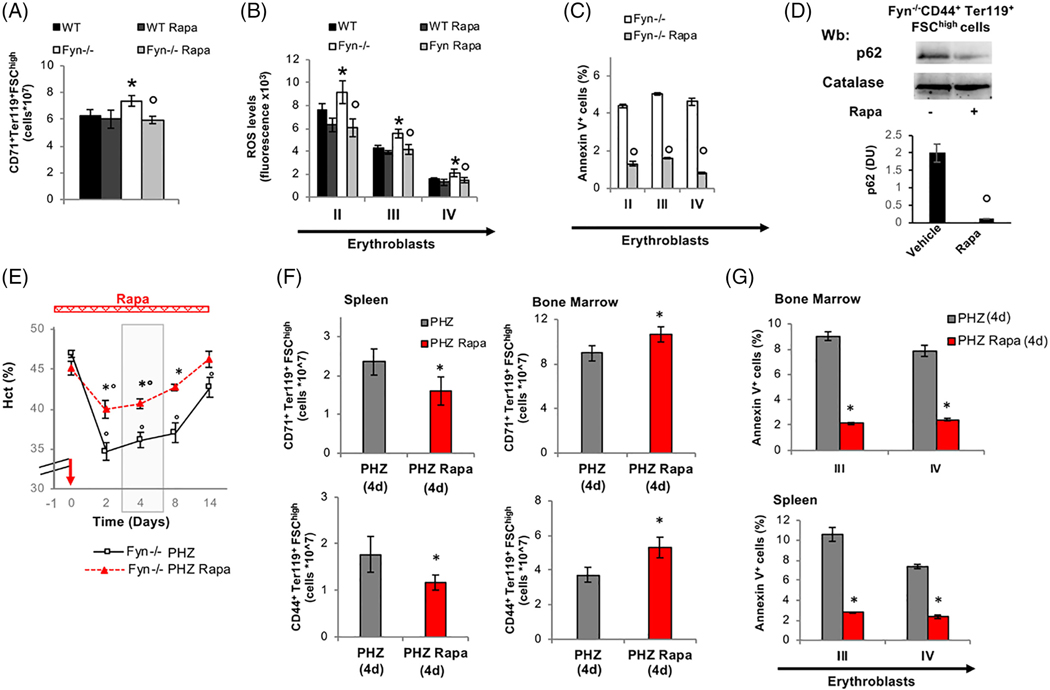
FIGURE 4.
The mTOR inhibitor, Rapamycin rescues the abnormal response of Fyn−/− erythroblasts to stress erythropoiesis. A, Effect of treatment with Rapamycin (Rapa) on total erythroid precursors (CD71-Ter119) from the bone marrow of WT and Fyn−/− mice. Data are presented as means ±SD (n = 6); *P < .05 compared to WT; °P < .05 compared to vehicle treated animals. B and C, Effect of Rapamycin treatment (Rapa) on ROS levels and Annexin V+ cells in erythroid precursors: Population II (pop II), corresponding to basophilic erythroblasts; population III (pop III), corresponding to polychromatic erythroblasts and population IV (pop IV), corresponding to orthochromatic erythroblasts from bone marrow of WT and Fyn−/− mice. Data are presented as means ±SD (n = 6 from each strain); * P < .05 compared to WT; P < .05 compared to vehicle treated animals. D, Western-blot (Wb) analysis of p62 in 1.5 ^106 sorted CD44+Ter119+FSChigh bone marrow cells with and without Rapamycin from Fyn−/− mice. Catalase was used as protein loading control. Densitometric analyses of the immunoblot bands similar to those shown are presented at right (DU: Densitometric unit). Data are shown as means ±SD (n = 4; *P < .01 compared to WT). E, Hematocrit (%) in Fyn−/− (n = 6) mice treated with either phenylhydrazine alone (PHZ) or combined with Rapamycin (Rapa- red bar is the time of treatment with it). The red arrow indicates the injection of PHZ. Data are presented as means ±SD; *P < .05 compared to PHZ treated animals; °P < .05 compared to baseline values. The gray area identifies the window time for characterization of the stress erythropoiesis in Fyn−/− mice. F, Cyto-fluorimetric analysis of total erythroid precursors from either bone marrow or spleen of Fyn−/− mice treated with either PHZ alone or Rapamycin (Rapa) plus PHZ (4 days after injection). Results from CD44-Ter119 (lower panel) or CD71Ter119 (upper panel) strategies are shown. Data are presented as means ±SD (n = 4); *P < .05 compared to PHZ treated animals; °P < .05 compared to baseline values. (G) Amount of Annexin V+ cells in population III (pop III), corresponding to polychromatic erythroblasts and population IV (pop IV), corresponding to orthochromatic erythroblasts from either spleen or bone marrow of Fyn−/− mice. Data are presented as means ±SD (n = 4 from each strain); *P < .05 compared to WT)

