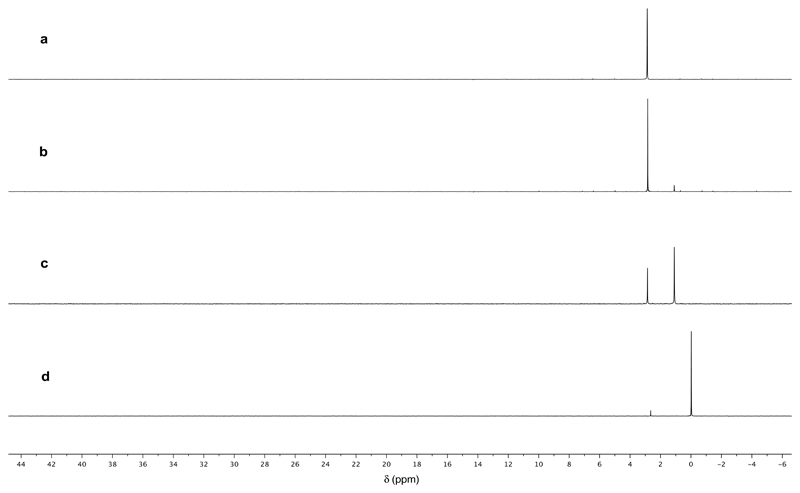
Fig. 2. Photochemical oxidation of phosphite.
a – 31P NMR Spectrum of a commercial sample of phosphite at pH 6.5; b – 31P NMR Spectrum of the irradiation of phosphite (30 mM) in 10% D2O after 4 h; c – 31P NMR Spectrum of the irradiation of phosphite (30 mM) in the presence of NaSH (50 mM) after 4 h according to Procedure 1; d – As spectrum C after 8 h irradiation. Differences in chemical shift are due to slight variations in pH.

