
Fig. 3.
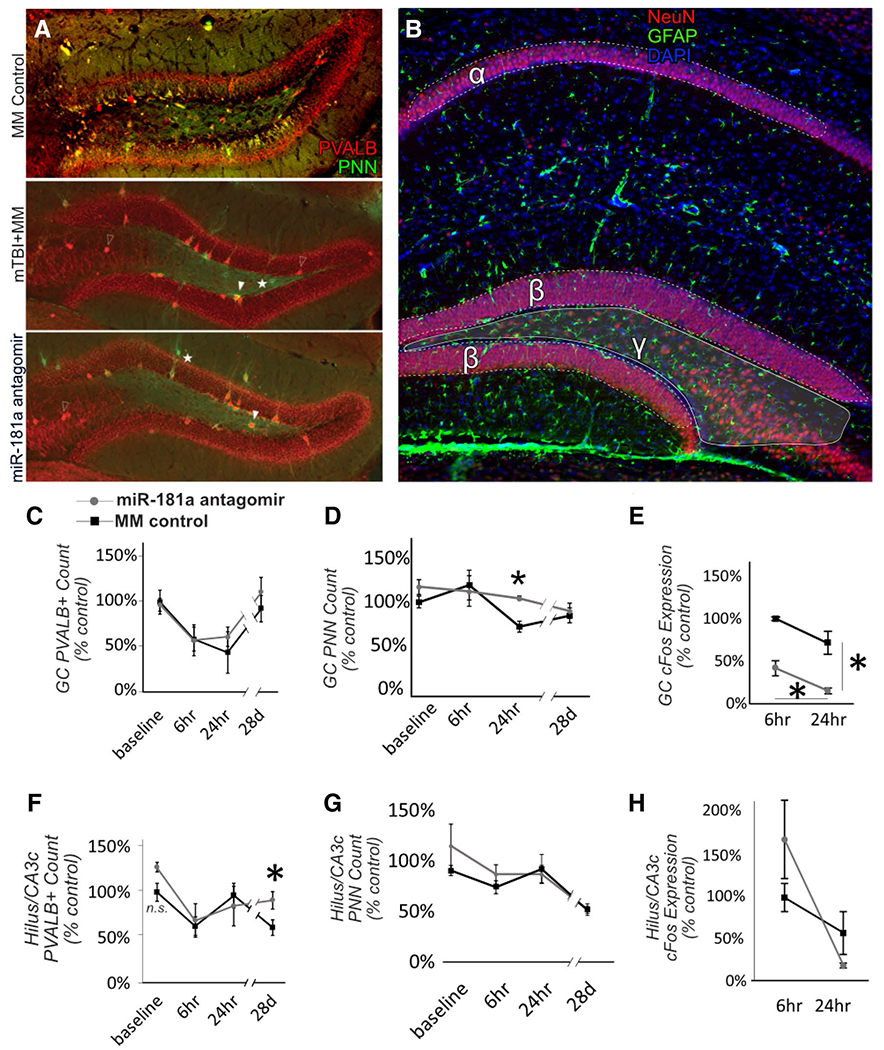
Hippocampal histopathology. Examples of fluorescent immunohistochemistry for assessment of hippocampal parvalbumin positive (PVALB+) neurons and perineuronal nets (PNN) for MM controls, and 28 d after mTBI in animals pre-treated with either miR-181a antagomir or MM control (a). For all analyses, hippocampal subregions were defined as (α) cornu ammonis-1, (β) the granule cell layer of the dentate gyrus and (γ) the dentate gyrus hilus/cornu ammonis-3c (b). Antagomir treatment resulted in a slight increase in PVALB expression in the DG hilus/CA3c. Open arrow = PVALB + interneuron, closed arrow = PVALB + PNN, Star = PNN only. Quantification of PVALB in the dentate gyrus (DG) granule cell (GC) layer (c) and in DG hilus/cornu ammonis-3c (CA3c, f). PNN quantification in GC layer (d) and hilus/CA3c (g) of DG. Neuronal activity in DG measured by cFos expression in GC layer (e) and hilus/CA3c (h). n = 6 per group, *p < .05, Error bars Mean ± SEM