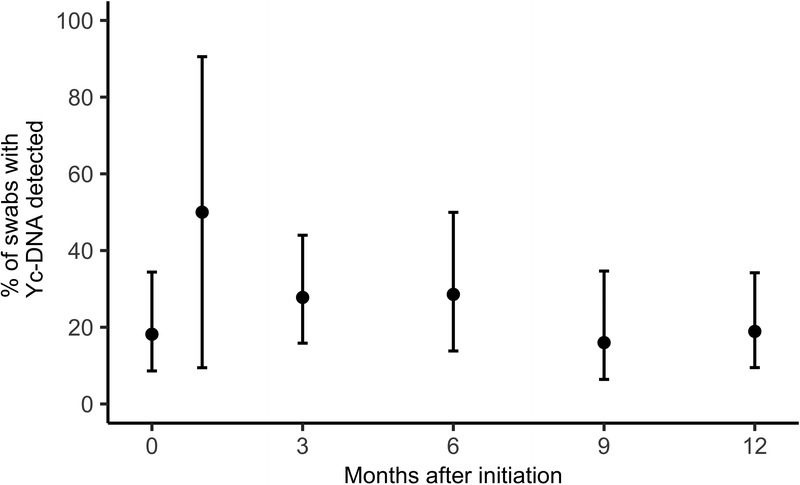
Figure 2.

Trends in Yc-DNA detection among FSWs participating in the Senegal PrEP demonstration project. Error bars represent 95% CIs. Number of swabs tested: Initiation: n = 33; month 1: n = 2; month 3: n = 36; month 6: n = 21; month 9: n = 25; month 12: n = 37. Relationship between Yc-DNA detection and month since initiation estimated from adjusted regression models fit using generalized estimating equations assuming an exchangeable working correlation structure. OR, 0.99 (95% CI, 0.90–1.08; P = 0.82).
