
Fig. 3.
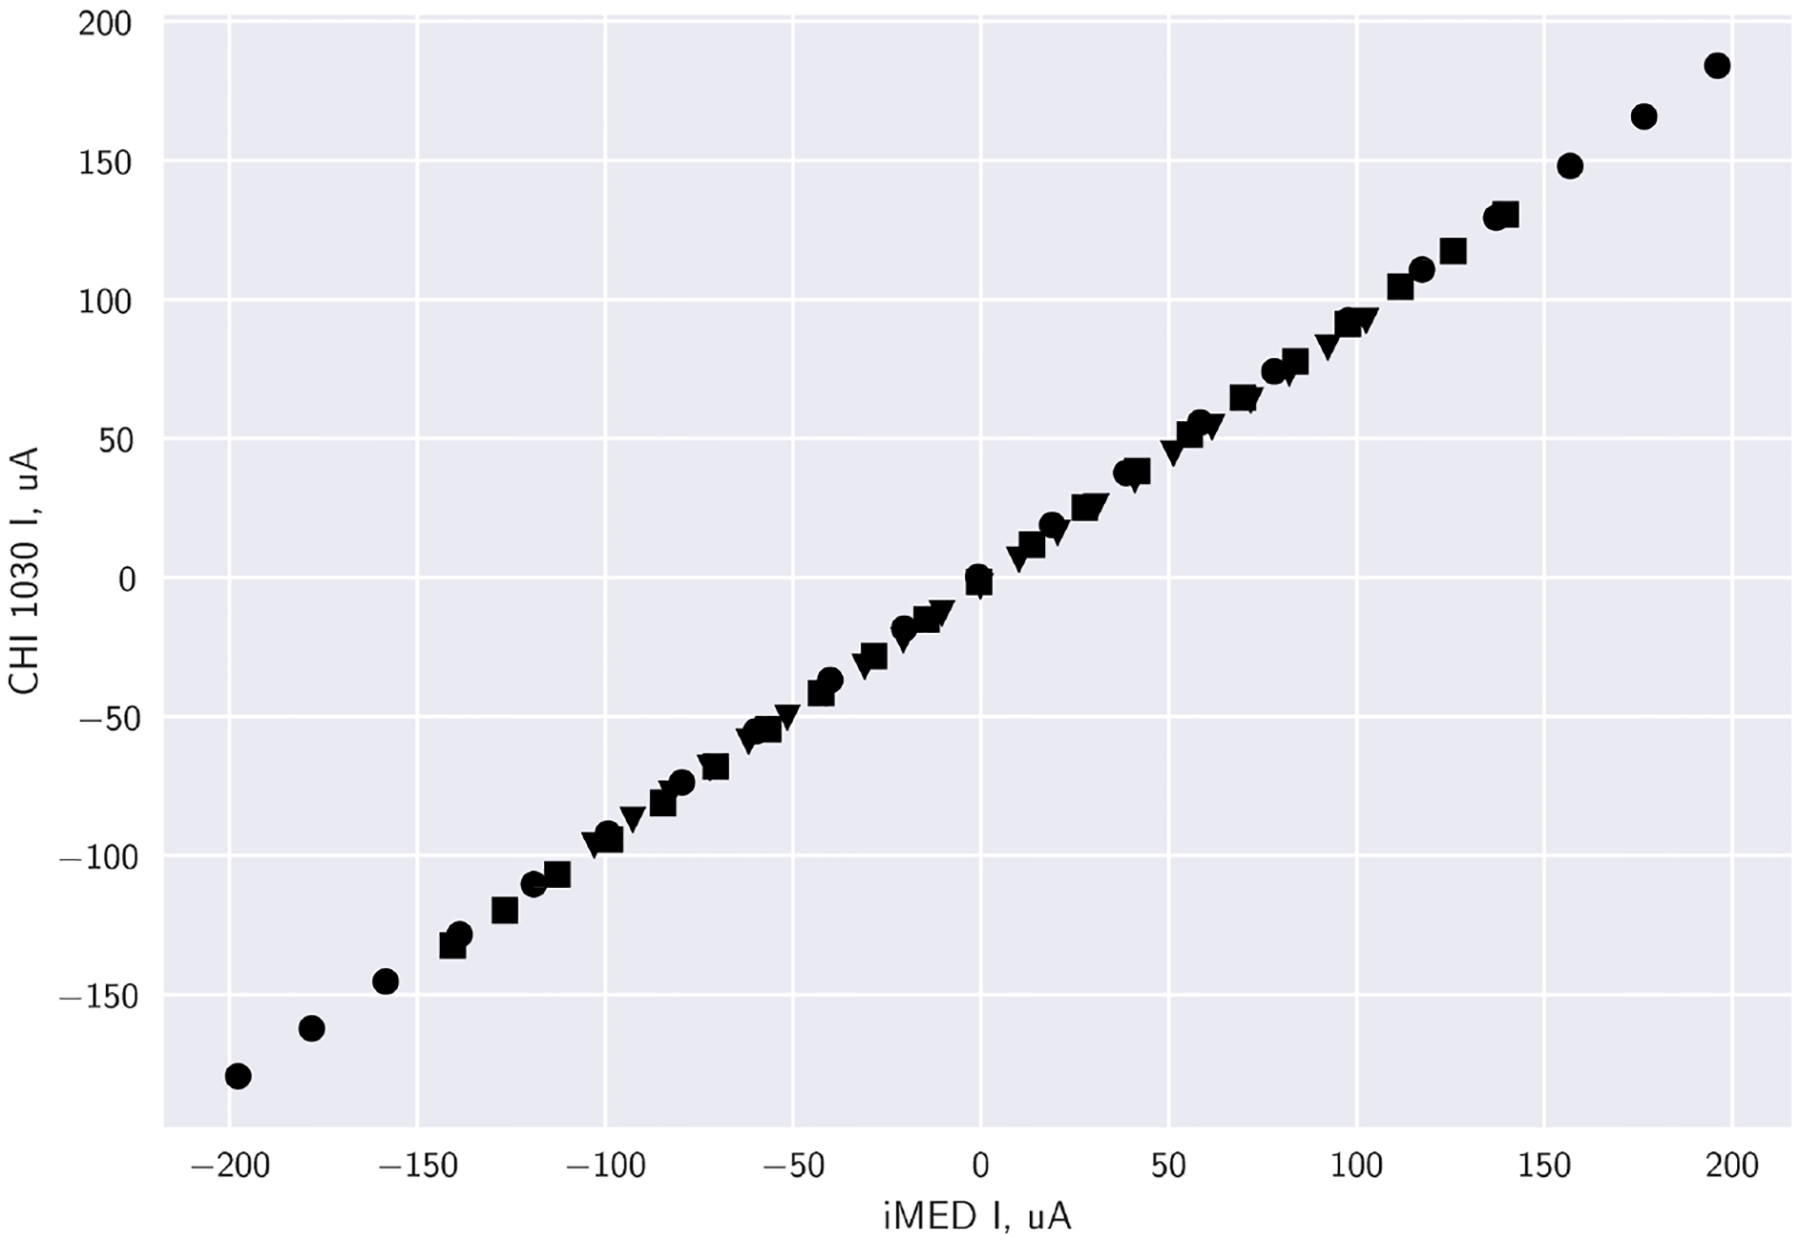
Resistor polarization plots of various resistors comparing commercial CHI 1030 and the iMED (averaged n = 4): 5.1 kΩ (●), 7.1 kΩ (■), 10 kΩ (▲). Data represents a 2 V potential window, with increments of 0.1 V.
Official websites use .gov
A
.gov website belongs to an official
government organization in the United States.
Secure .gov websites use HTTPS
A lock (
) or https:// means you've safely
connected to the .gov website. Share sensitive
information only on official, secure websites.
Resistor polarization plots of various resistors comparing commercial CHI 1030 and the iMED (averaged n = 4): 5.1 kΩ (●), 7.1 kΩ (■), 10 kΩ (▲). Data represents a 2 V potential window, with increments of 0.1 V.