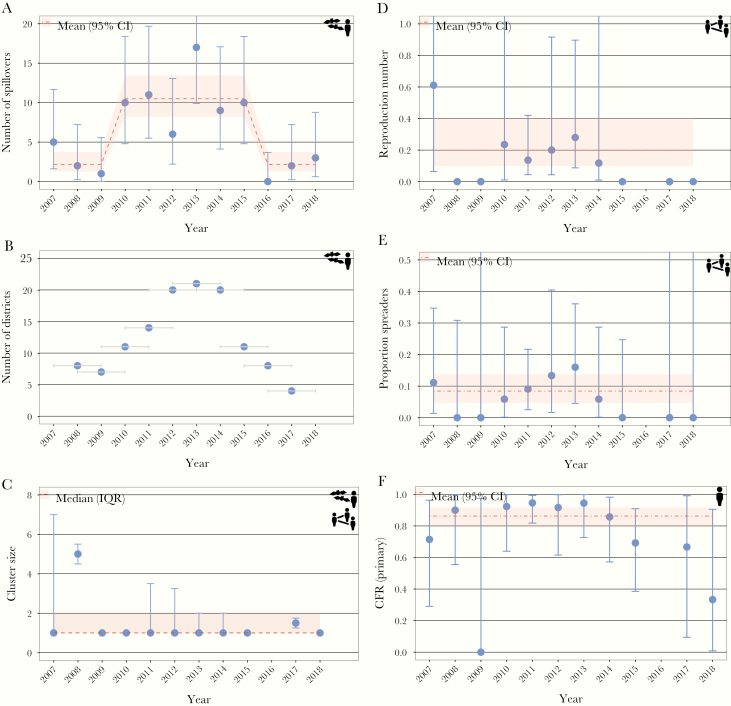
Figure 2.
Baseline estimates and historical changes of key indicators to monitor NiV epidemiology and transmission. Average number of spillovers (Poisson exact 95% confidence interval [CI]) (A), number of districts reporting NiV cases within 3-year window (time windows are indicated as gray bars) (B), median cluster size (interquartile range) (C), reproduction number (negative binomial 95% CI) (D), proportion spreaders (binomial exact 95% CI) (E), and case fatality ratio among primary cases, i.e., cases infected by the reservoir (binomial exact 95% CI) (F). The year represents a transmission season, which lasts from December of the previous year until May of the indicated year.

