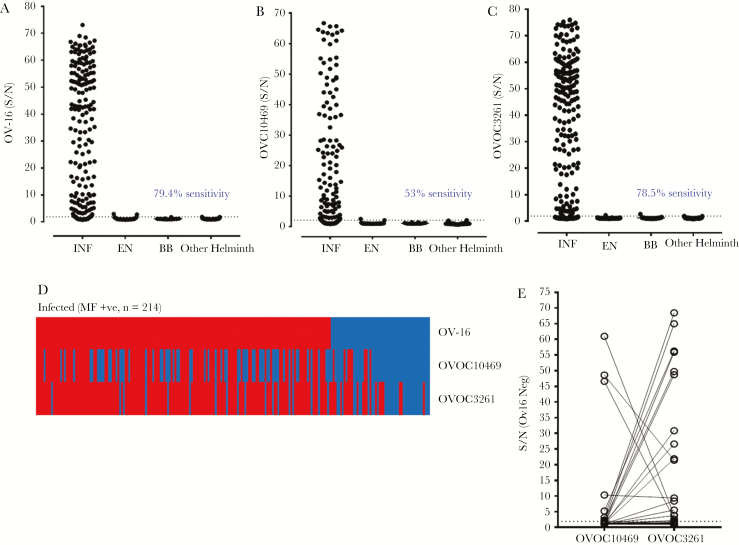
Figure 3.
Comparison of IgG4 responses to OV-16, rOVOC10469, and rOVOC3261 by enzyme-linked immunosorbent assay (ELISA). The scatter plots depict the signal to noise values (S/N) of OV-16 (A), rOVOC10469 (B), and rOVOC3261 (C) reactivity in sera of Onchocerca volvulus-infected (INF), endemic normal (EN), healthy US blood bank volunteers (BB), and Wuchereria bancrofti, Loa loa, Strongyloides stercoralis (other helminth) infections by ELISA. The dotted lines denote the receiver operating characteristic (ROC) cutoff values using the other helminth group as control. D, Heat map depicts the samples classified as positive (red) or negative (blue) for OV-16, rOVOC10469, and rOVOC3261 based on ROC. E, Signal to noise ratio of OV-16–negative sera (blue segment from heat map shown in Figure 3D) showing the differential reactivity to rOVOC10469 and rOVOC3261.

