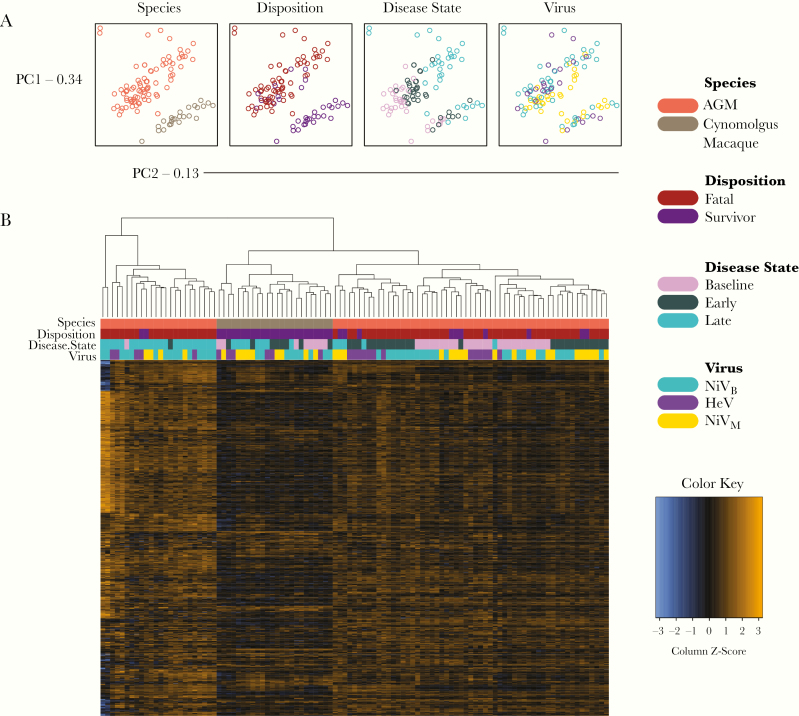
Figure 2.
Transcriptional changes grouped by each covariate. (A), Principal component analysis of all differentially expressed transcripts at baseline, early, and late disease. Shown are individual samples isolated by species, disposition, disease state, or challenge virus. (B), Heat map of normalized data generated via unsupervised clustering. Data were scaled to give all genes equal variance. Orange indicates high expression (z-scores); blue indicates low expression. Baseline (pre-challenge); early disease (3 days post infection); late disease (7 days post infection in survivors, or the terminal time point in fatal subjects). Specific P-values for each transcript and comparison are provided in Supplementary Data 1. Abbreviations: AGM, African green monkey; HeV, Hendra virus; NiVB, Nipah virus Bangladesh; NiVM, Nipah virus Malaysia; PC1, principal component 1; PC2, principal component 2.

