
Figure 3. EZH2, miR-26a, and miR-101 levels with oxidative stress.
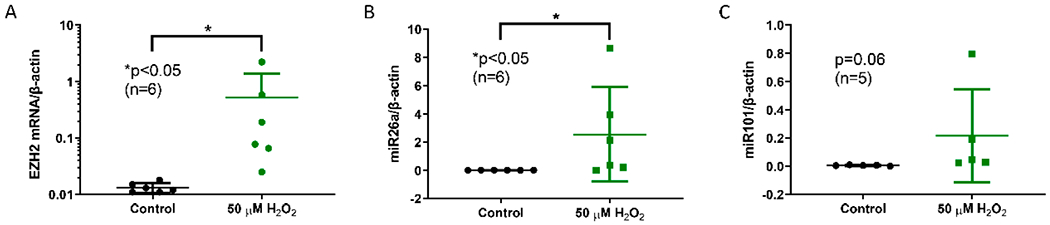
(A) EZH2 mRNA levels were markedly increased with 50 μM H2O2 treatment. (B) miR-26a levels were increased by H2O2 exposure. (C) A trend for higher miR-101 levels with H2O2 exposure was noted. Naïve CD4+ T cells were stimulated with anti-CD3 (10 μg/mL) and anti-CD 28 (2.5 μg/mL) overnight. Cells were treated with and without 50 μM H2O2 for 3 days. Data are shown as mean ± standard deviation.