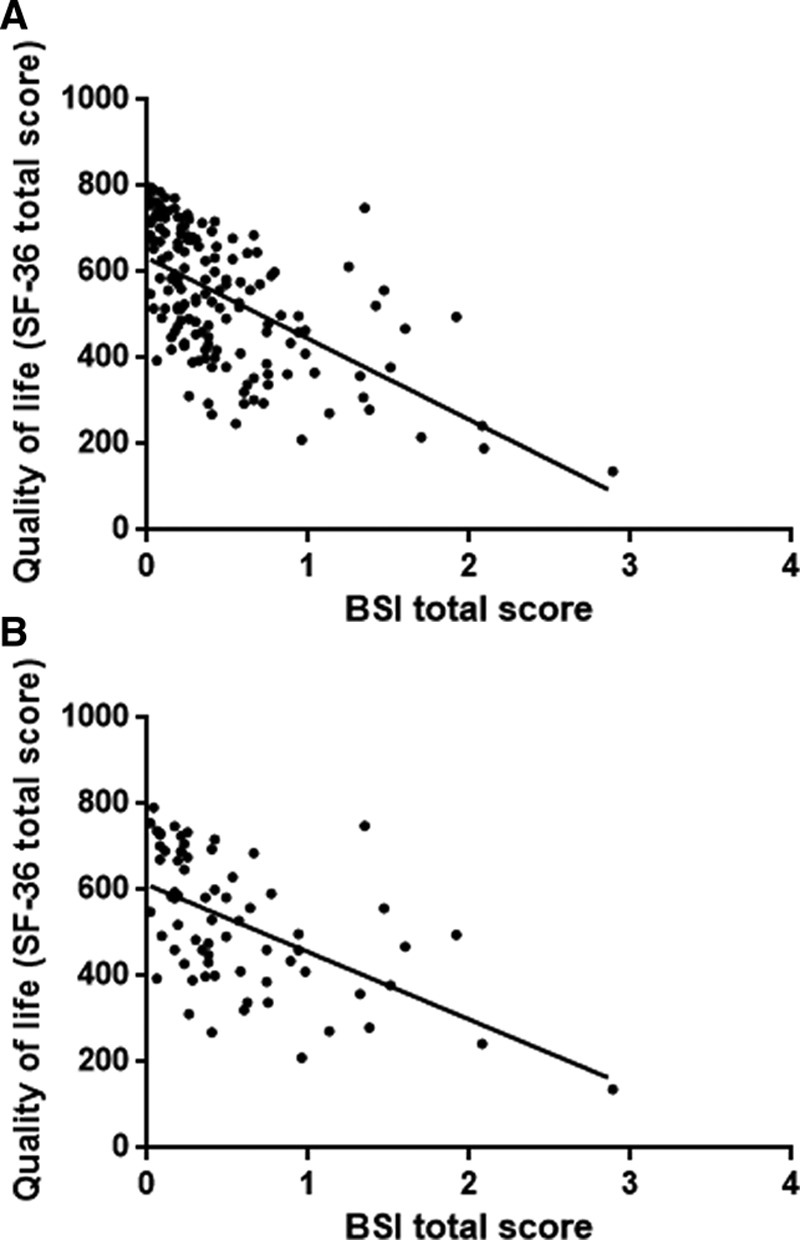
FIGURE 3.

Scatter diagrams and correlation between SF-36 total score and BSI total score. A, Pre-SPK, post–SPK, and T1D reference patients (r = 0.62, P < 0.001). B, Only post-SPK group (r = 0.59, P < 0.001). BSI, brief symptom inventory; SF-36, short form-36; SPK, simultaneous pancreas/kidney; T1D, type 1 diabetes reference group.
