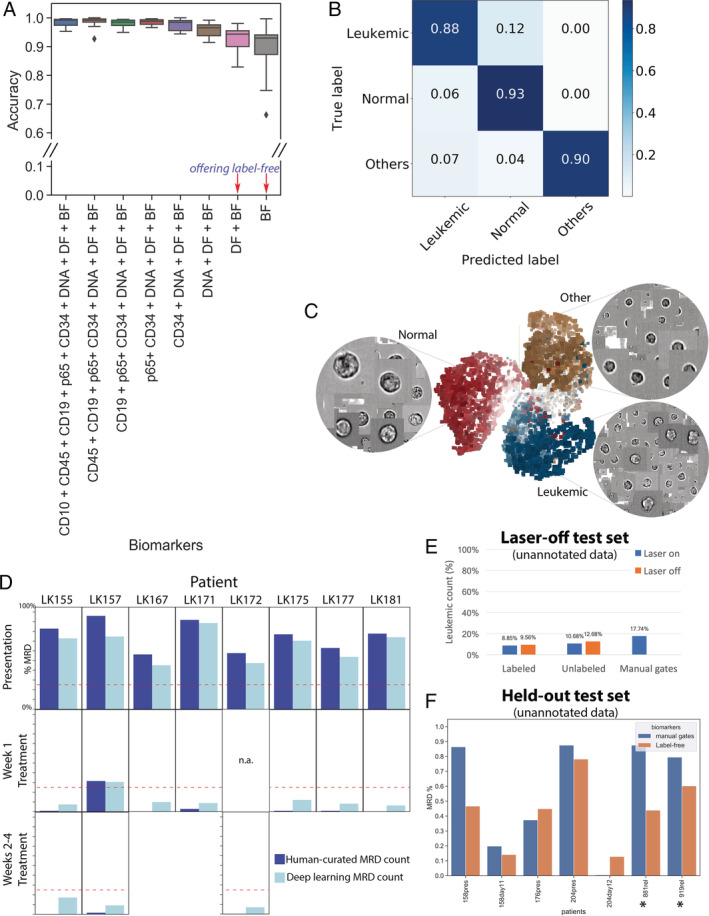
Figure 2.

Label‐free identification of ALL cells by ResNet50 corresponds well with biomarker‐based analysis. (A) Prediction results on each of 11 test data entries from five patients, who have data at the time of presentation and during treatment (average accuracy from single‐cell classification) (Test 1). The first column reports average accuracy across samples using all channels; subsequent columns correspond to incremental dropping of the next channel. BF, bright‐field; DF, dark‐field. Boxplots show the median line, first and third quartiles. Whiskers are drawn to double interquartile range (+2IQR). Diamonds represent data events that are outside the low and high whisker ends. (B) Three‐class single‐cell classification using bright‐field and dark‐field channels (Test 1). Confusion matrix for three categories, n = 218,747 ground‐truth cells pooled from 11 test sets. (C) Clustering of 9,025 cells randomly sampled from patient LK157 at the time of presentation based on deep learning features. 3D t‐Distributed Stochastic Neighbor Embedding (t‐SNE)20 presentations based on 2,048 label‐free feature vectors for each cell from the second‐to‐last layer of the trained neural network, ResNet50, are shown. The t‐SNE calculation was stabilized after 400 iterations at perplexity of 30. Colors coded according to true class labels: Leukemic cells (blue), normal B lymphocytes (red), other cell types (yellow). The magnified images display true bright‐field channel, randomly zoomed at each cluster. Example data with overlaid images http://projector.tensorflow.org/?config=raw.githubusercontent.com/minh‐doan/Deeplearning_LabelFree_Leukemia/master/Publish/DL_supervised/Data/Step4/Output/projector_config.pbtxt can be visualized with a web‐based projector. (D) Comparison between human‐curated manual gates and label‐free deep learning in predicting residual disease fraction (Test 2). The prediction on each sample was performed on the DAPI‐positive population of in‐focus, white blood cells, which is a mixture of leukemic blasts, normal B lymphocytes, other mature and immature hematopoietic cells such as granulocytes and monocytes. Red dash‐line is 25%—the threshold of treatment effectiveness of chemotherapy. (E) Summary of residual disease estimated by deep learning using information in bright‐field channel of labeled/unlabeled samples (each with laser on/off settings) (Test 3). Residual disease fraction was calculated as the percentage of predicted leukemic cells over the whole population of unannotated in‐focus single cells. For reference, human‐curated manual residual disease fraction (last blue column) was estimated based on the stained version with laser on. (F) Result of label‐free deep learning residual disease readout (yellow columns) on unannotated in‐focus single cells in held‐out data (Test 4). Blue columns are residual disease readout reported by standard clinical flow cytometric protocol. LK881 and LK919 (asterisks) are relapsed ALL patients. [Color figure can be viewed at wileyonlinelibrary.com]
