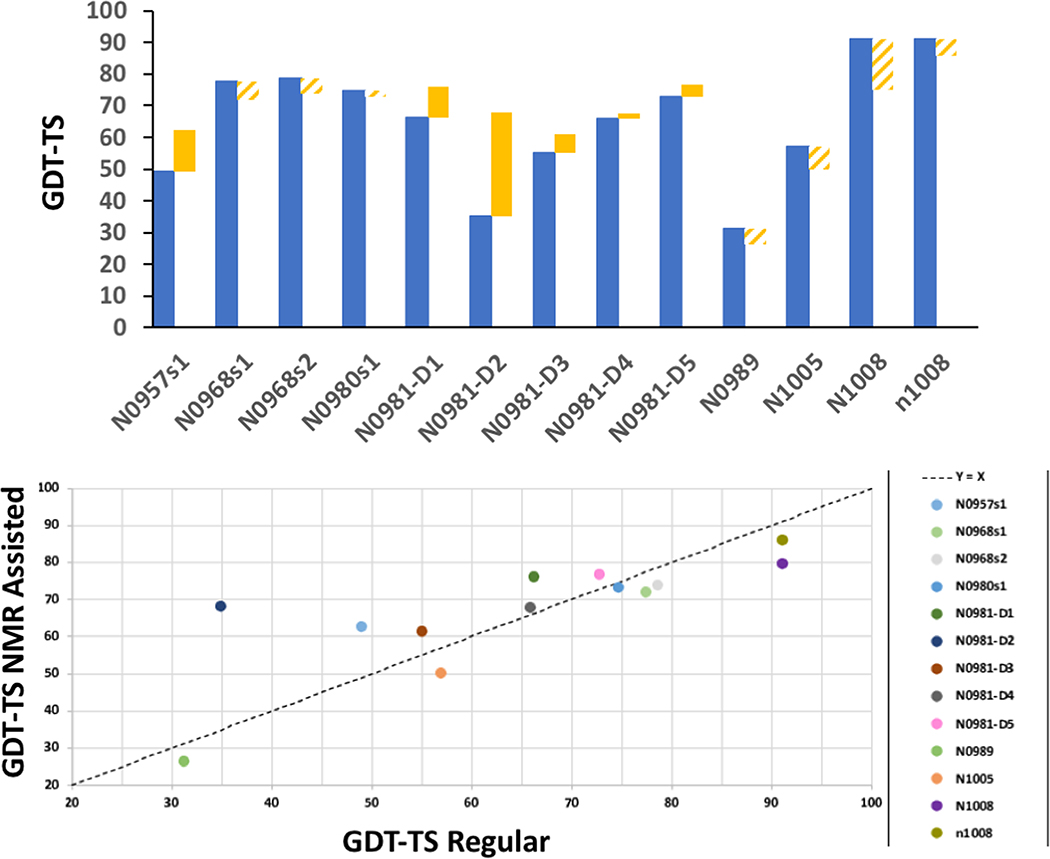
Fig. 7. Best NMR Assisted vs Best Regular Predictions.
(A) GDT-TS scores for the best model submitted by any NMR-assisted prediction group (blue bars) compared with the best model submitted by any regular prediction group (yellow bars). The solid yellow bars indicate targets for which the best model submitted by any regular prediction was more accurate than the best model submitted by any NMR-assisted prediction group. The hashed-yellow bars indicate targets for which the best model submitted by any regular prediction was less accurate than the best model submitted by any NMR-assisted prediction group. (B) Scatter plot comparing the GDT-TS scores for the best model submitted by any regular prediction versus the best model submitted by any NMR-assisted prediction.

