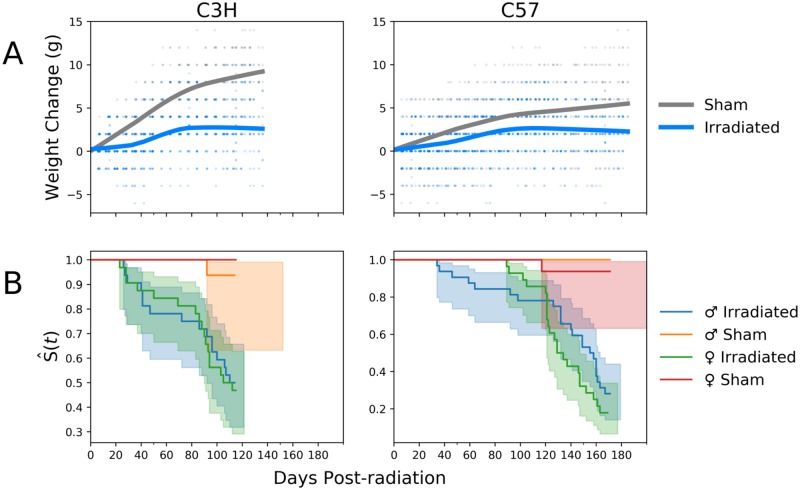
Fig 2. Changes in weight and Kaplan-Meier survival curves for WTLI and sham irradiated C3H and C57 mice by gender.
(A) Irradiated mice failed to gain weight compared to sham irradiated controls in both strains. (B) Kaplan-Meier curves show no gender-based differences (C57: p-value = 0.1, C3H: p-value = 0.8, log rank test), with C57 mice surviving longer than C3H, on average.

