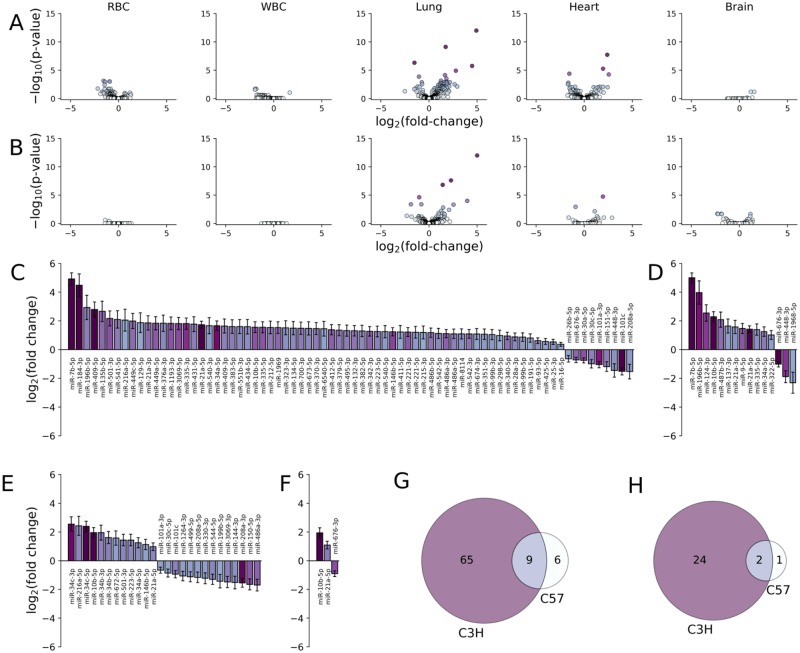
Fig 4. Differentially expressed miRNA in tissues from irradiated mice at the study endpoint compared to controls.
Volcano plots showing the log2 fold-change versus–log10 p-value for each miRNA in C3H (n = 15, at month 4; A) and C57 (n = 20, at month 6; B) mice extracted from the indicated tissue. Significant changes in miRNA expression was observed in lung tissue 4 (C3H) and 6 (C57) months after WTLI. (C and E) Log2 fold change in expression for miRNA in lung tissue with statistically significant changes in expression (p-value < 0.05) in WTLI versus control C3H and C57 mice, respectively. (D and F) Log2 fold change in expression for miRNA in heart tissue with statistically significant changes in expression (p-value < 0.05) in WTLI versus control C3H and C57 mice, respectively. (G and H) Venn diagrams for miRNA expressed in lung and heart tissue (respectively) in C3H and C57 mice.

