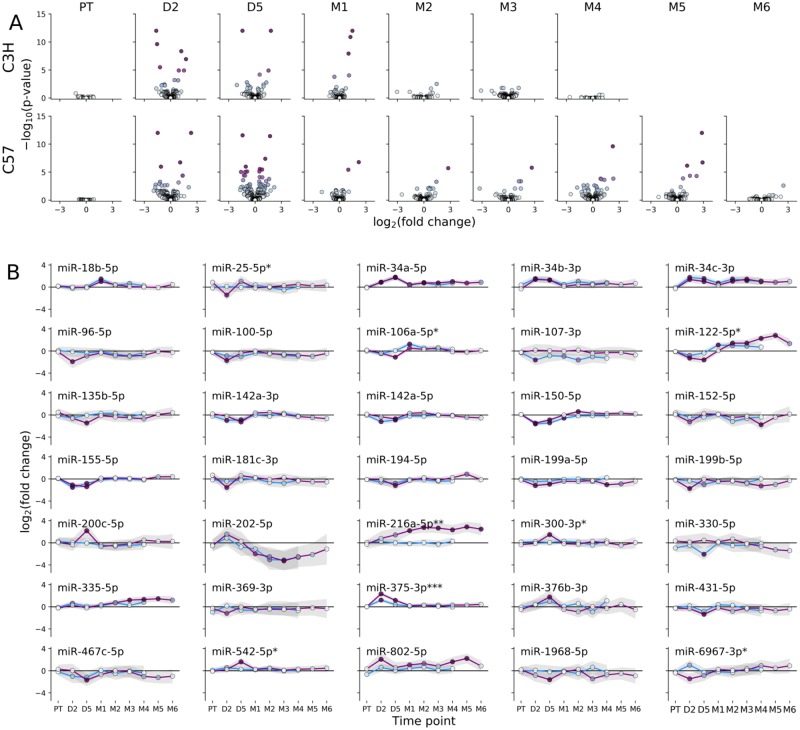
Fig 5. Differentially expressed miRNA in plasma from irradiated mice during the first four to six months after exposure.
(A) Volcano plots showing the log2 fold-change versus–log10 p-value for plasma miRNA in WTLI versus sham irradiated controls at the indicated time points and strains. (B) Temporal expression profile for differentially expressed miRNA (> 2.5-fold change in expression and p-value < 0.05) in plasma for C3H (blue line) or C57 (purple line) mice. Statistical differences between strains were evaluated by two-way ANOVA and indicated with an asterisk (* indicates 0.005 ≤ p-value < 0.05, ** indicates 0.0005 ≤ p-value < 0.005, *** indicates p-value < 0.0005).

