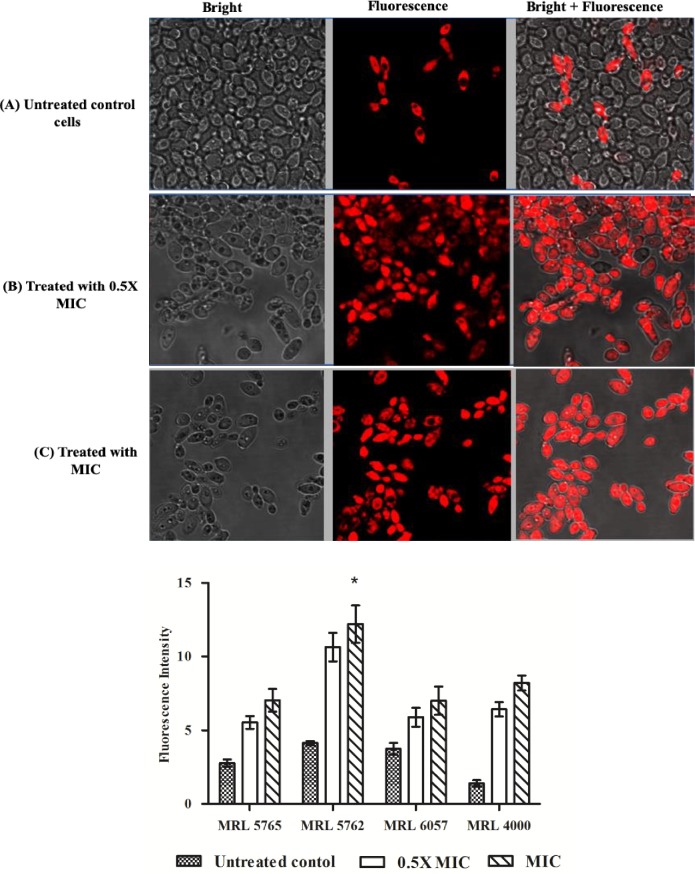
Fig 5. R6G intracellular accumulation.
Fluorescence images of R6G stained C. auris MRL 5765 cells. The isolate was observed under bright field and fluorescence microscopy. (A) The figure shows untreated C. auris cells that have effluxes R6G dye during incubation with glucose and only few cells retain R6G fluorescence. Treatment with 0.5 × MIC (B) and MIC (C) results in accumulation of R6G inside the cells after incubation with glucose which is clearly represented by high fluorescence inside the cells. (D) Fluorescence intensity is represented in the form of bar graph and was quantified with the help of Image J software.

