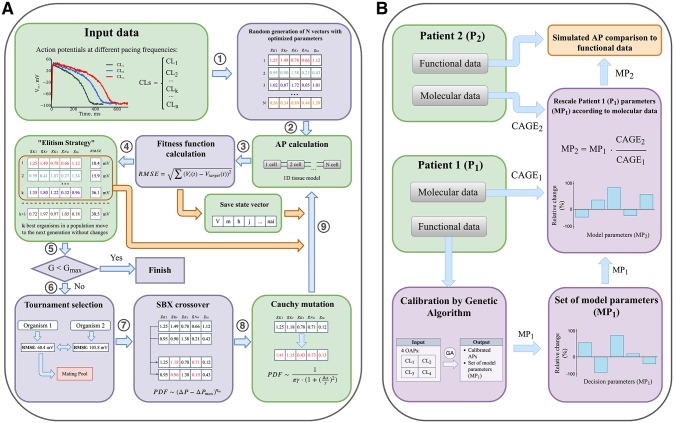
Fig 1. Genetic Algorithm (GA) and CAGE-based personalization block diagrams.
(A) Genetic algorithm schematic diagram. Initially a set of organisms is generated, each of which is determined by a random vector of scaling factors for optimized model parameters (step 1). For each organism AP waveforms are calculated at several pacing frequencies (cycle lengths) and compared with the input APs (steps 3, 4). Organisms with the lowest Root Mean Square Error (RMSE) value are saved and directly copied into the subsequent generation, replacing the worst organisms (orange arrow). State vectors (intracellular concentration, gating variables etc) are also saved after each short simulation and reused as initial state during simulation in the next generation. After selection (step 6) the fittest organisms form the mating pool are modified by SBX crossover and Cauchy mutation (step 7, 8). Modified organisms move to the next generation (9). Process of AP and fitness function calculation, selection, crossover and mutation and elite replacement is repeated until the stop criterion is fulfilled. The algorithm is based on [3], modifications of the original algorithm are highlighted by green. (B) Algorithm verification with molecular (mRNA expression) and functional data (optical mapping). Patient 1 model parameters (MP1) were determined by GA. Patient 1 parameters (MP1) were rescaled proportional to Patient 2/Patient 1 mRNA expression level ratio (CAGE2/ CAGE1) and verified against functional data.

