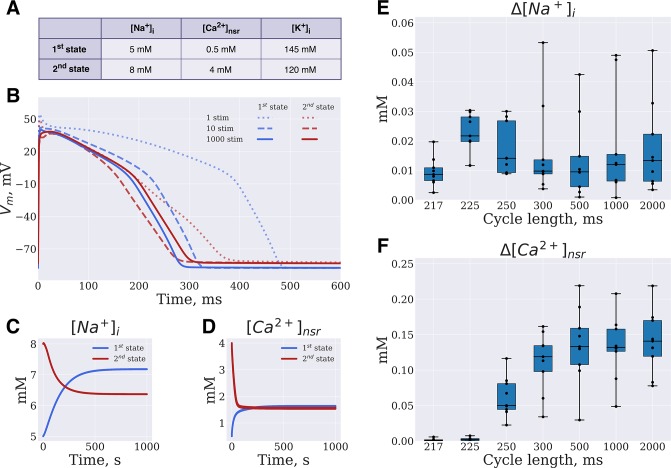
Fig 2. Model convergence to steady state.
(A,B) The single-cell O’Hara-Rudy model was paced at 1Hz frequency for 1000 s, from different initial intracellular concentrations (initial concentrations are listed on panel A). AP waveform on the 1st, 10th and 1000th beats are depicted by dotted, dashed and solid lines correspondingly. (C, D) [Na+]i and [Ca2+]nsr concentrations change during the simulations. (E, F) Box-and-whiskers plots depict GA output [Na+]i and [Ca2+]nsr concentrations distance from steady state values.

