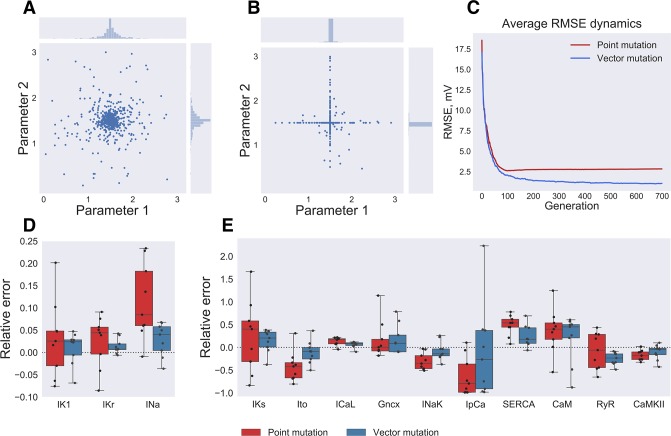
Fig 3. Random mutation direction in multi-dimensional parameter space.
(A) Vector mutation: random mutation direction choice, blue points indicate parameter values after mutation. (B) Point mutation: each parameter value is mutated with fixed probability, which results in low probability to mutate parameter value in diagonal direction. (C) RMSE averaged over all organisms of 9 GA runs plotted against generation number. Red and blue lines correspond to point and vector mutations, respectively. (D, E) Objective parameters distribution for 9 GA runs with point mutation (red boxes) and vector mutation (blue boxes). Dashed line corresponds to the input model parameter values.

