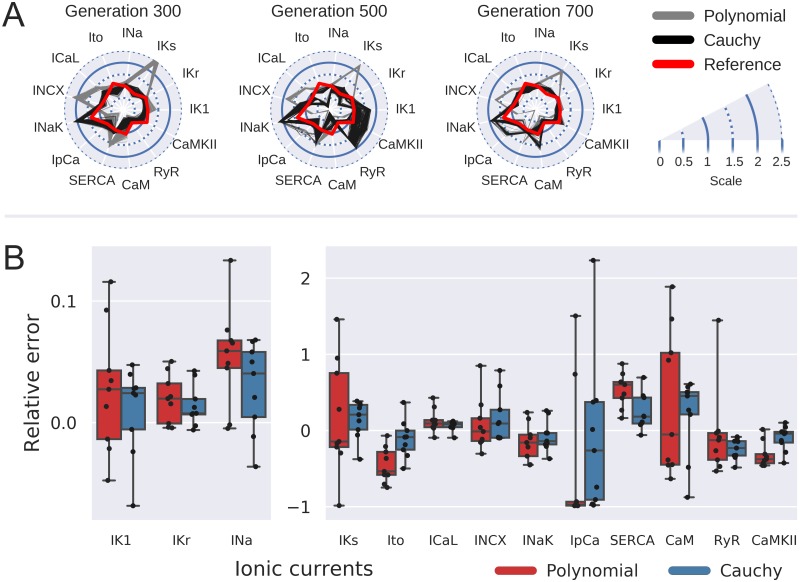
Fig 5. Cauchy mutation.
(A) Radar plots illustrating algorithm convergence in case of Cauchy (black) vs Polynomial (grey) mutations. Synthetic AP with parameter values shown by red line was used as input data. Axes show parameters ratio to corresponding O’Hara-Rudy model [12] values. (B) Objective parameters distribution for 9 GA runs with Polynomial mutation (red boxes) and Cauchy mutation (blue boxes). Dashed line corresponds to the input model parameter values. All values shown correspond to the best organism on generation 700.

