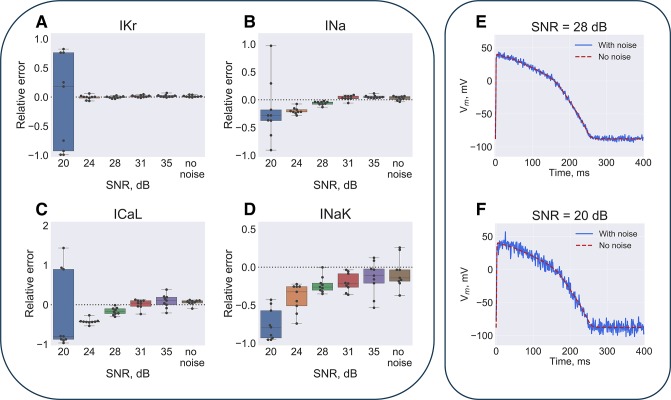
Fig 8. Solution sensitivity to the input baselines signal-to-noise ratio (SNR).
The input model AP waveform was distorted by Gaussian noise. (A) Parameters dependence on the SNR is illustrated at generation 700 of 9 GA runs. Dashed line depicts the input model parameter value. (B) Sample AP waveform at 28 dB and 20 dB SNR.

