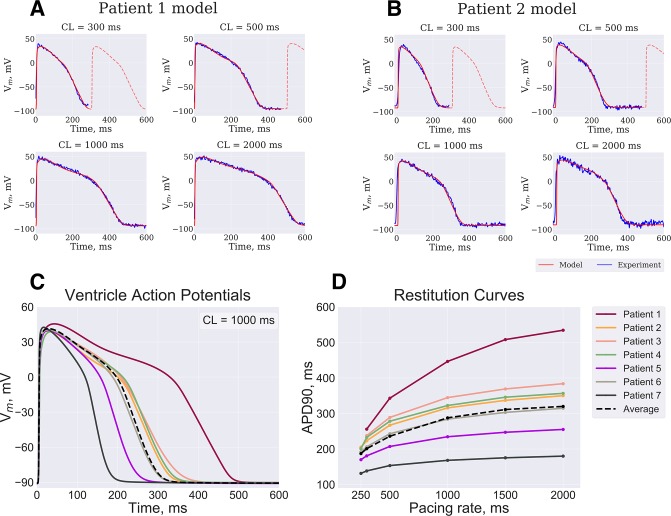
Fig 9. Algorithm verification.
(A) Patient 2 (see text for details) model APs (red line) fitted by GA as compared to the optical APs (blue) recorded at CL of 2000 ms, 1000 ms, 500 ms and 300 ms. (B) Patient 1 model was rescaled using mRNA expression data and compared to experimental APs (see Fig 1B). Personalized models based on mRNA expression data from 7 donor hearts ventricles demonstrate different AP waveform (C) and restitution properties (D).

