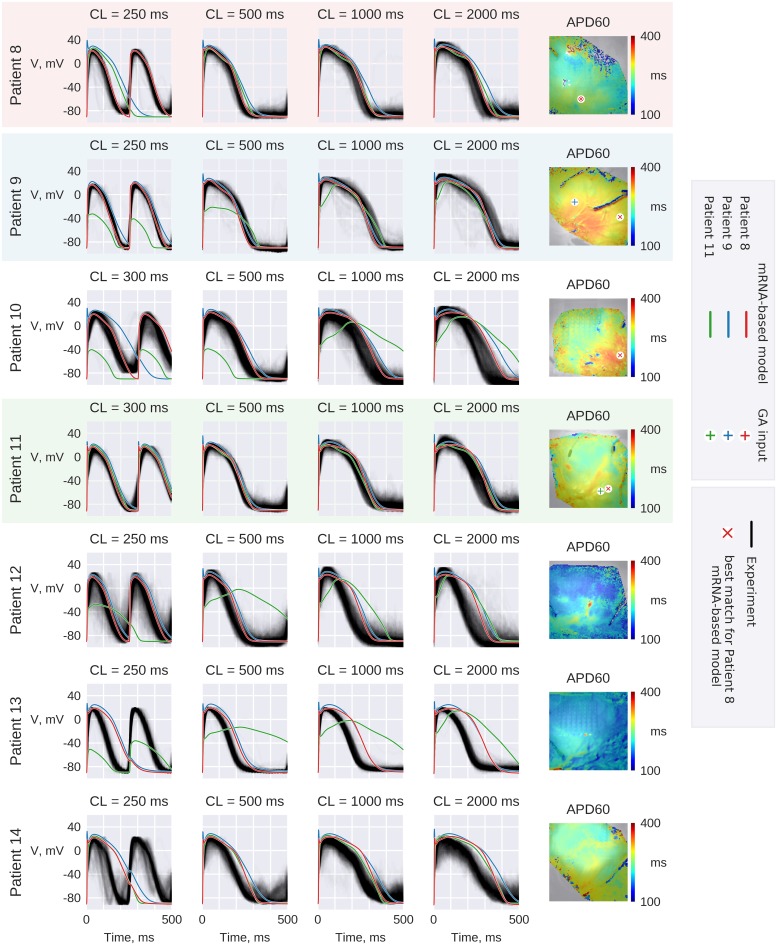
Fig 10. RVOT experimental recordings.
Gray lines depict AP waveforms recorded from the wedge preparations. Experimental waveforms are aligned to match the time corresponding to (dV/dt)MAX. Red lines correspond to Patient 8 GA-output model with parameters rescaled according to Patients 9–14 mRNA profiles. Similarly, blue and green lines correspond to Patient 9 and 11 based models correspondingly. The pixels of AP waveform recording that was used as input to GA is labeled by “+” symbols on APD maps. The pixel of the recording that was used on Fig 11 to compare Patient 8 based models with experimental AP is marked by red x on the APD maps.

