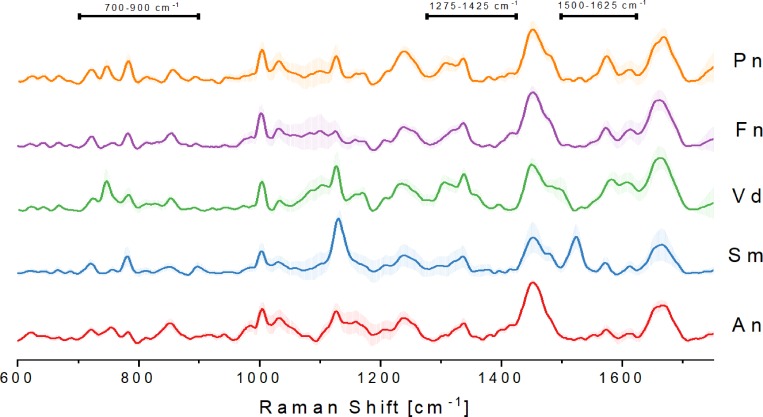
Fig 1. Averaged processed Raman signal (84 spectra total) from five different subgingival species of the calibration group with standard deviations.
A.naeslundii (An), S.mutans (Sm), V.dispar (Vd), F.nucleatum (Fn) and P.nigrescens (Pn). Areas of differences in bands between species are indicated (700–900 cm-1, 1275–1425 cm-1, 1500–1625 cm-1).

