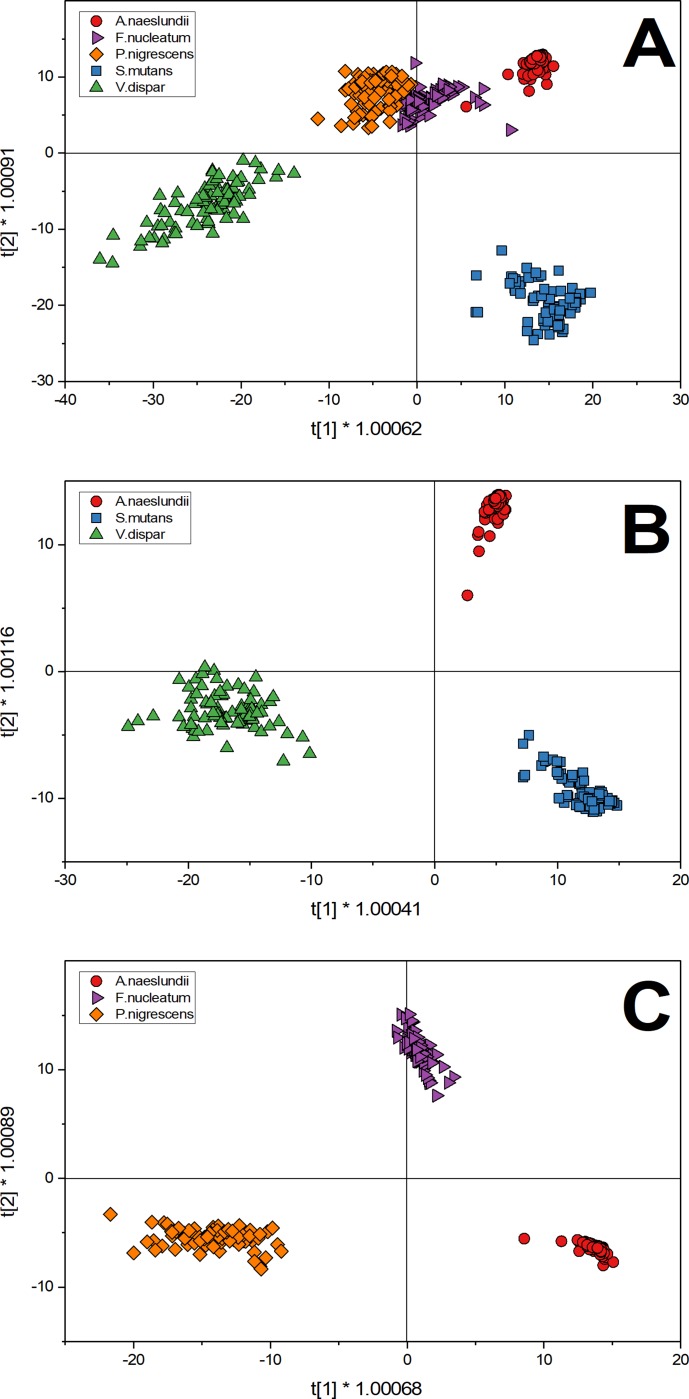
Fig 2. O2PLS-DA analysis of selected oral bacteria show the distribution of the first derivative of spectra (84 spectral samples for each strain) after discriminant analysis in a score plot.
A) T-score plot of five species: A.naeslundii (red circles), S.mutans (blue square), V.dispar (green triangle), F.nucleatum (purple triangle) and P.nigrescens (orange diamond). B) T-score plot of three species that showed distinct clusters in the five species score plot: A.naeslundii (red circles), S.mutans (blue square) and V.dispar (green triangle). C) T-score plot of three species that showed one cluster in the five species score plot: A.naeslundii (red circles), F.nucleatum (purple triangle) and P.nigrescens (orange diamond).

