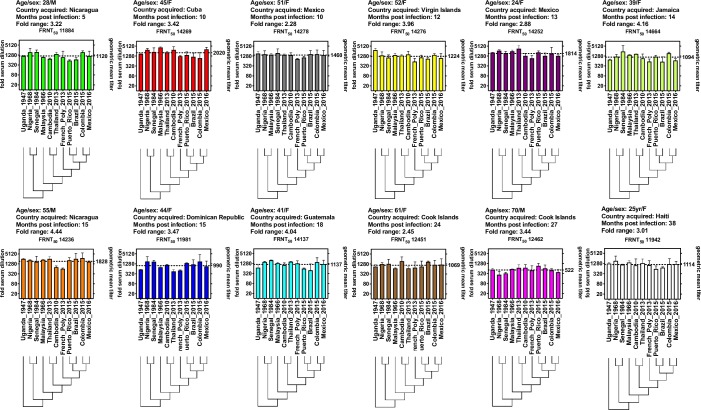
Fig 2. FRNT50 titers for subject sera against each virus.
Fold serum dilution is shown on the left Y-axis, geometric mean titer (GMT) for each subject against all 11 viruses is plotted on the right Y-axis. Viruses and their relative phylogenetic relationships are shown on the X-axis. Subject age, gender, country infection acquired, months post-infection and fold-FRNT50 range are reported above each serum plot. The sera are ordered left to right from most recent to most remote infection.

