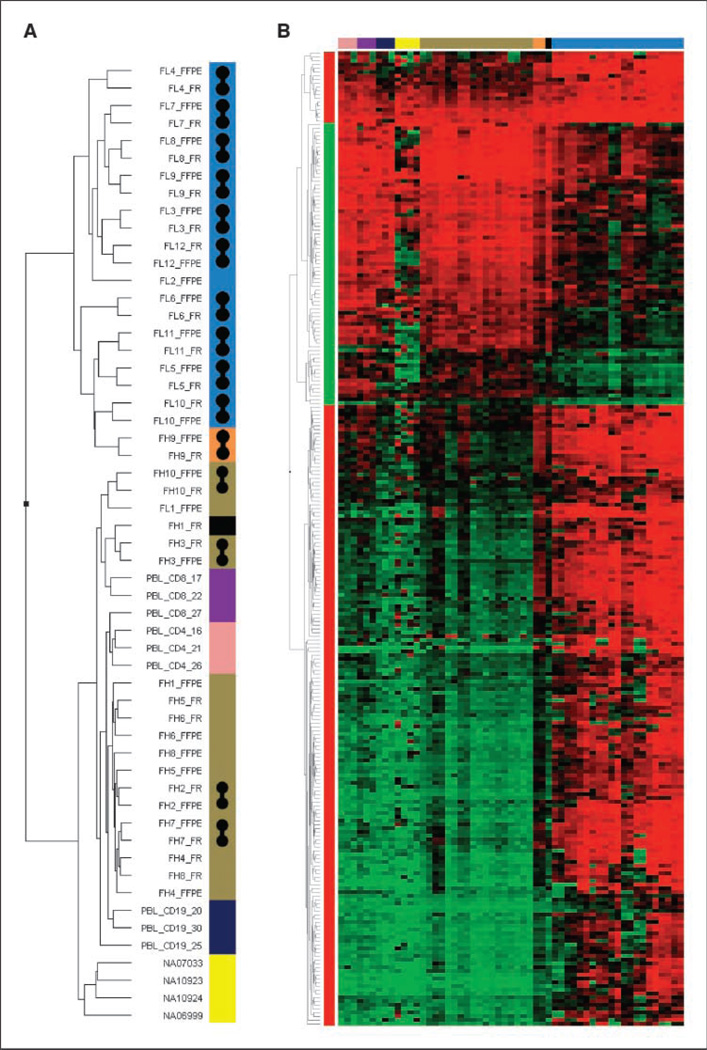
Figure 2.
A, dendrogram of unsupervised hierarchical classification of all samples in the study based on 259 DMT profile. Blue, FL; orange, MCD; yellow, lymphoblastoid cell lines; pink, PBL CD4+ T cells; purple, PBL CD8+ T cells; dark blue, PBL B cells; brown, reactive lymph nodes; black, noncancerous lymph node tissue adjacent lymphoma. Gray barbells, matched FFPE and frozen lymph node pairs that cosegregate. B, heatmap of unsupervised hierarchical cluster of 259 DMT β values from above cases. Same color code applies.

