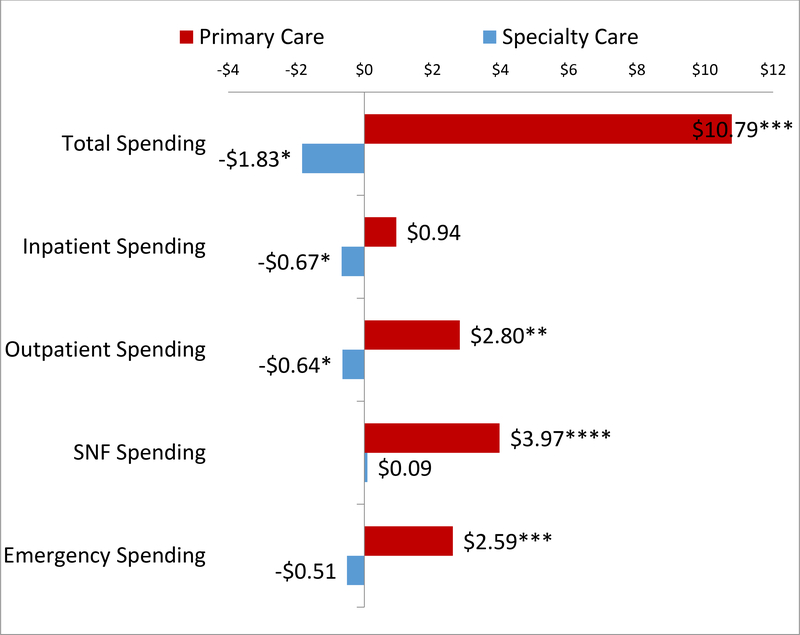
Exhibit 3.
Association between Percentage Point Increase in Out-of-Network Primary Care and Specialty Care and Per-Beneficiary-Per-Quarter Spending, by Spending Category
Source: Authors’ analysis of 2012–2015 Medicare Claims
Notes: Bars indicate marginal effect of percentage point increase in out-of-network care on spending category. One model was run for each spending category. Models include ACO and quarter-year fixed effects and the following controls (not shown): sex, race, age, Medicare/Medicaid dual eligibility, Hierarchical Condition Categories (HCC), whether the beneficiary was a new Medicare enrollee, percent of ACO providers that were primary care providers, number of beneficiaries (based on number of beneficiaries in sample), number of providers, ACO leadership (hospital, physician, or joint), whether the ACO included a critical access hospital, federally qualified health center, and/or acute care hospital, ACO risk-bearing status (1-sided or 2-sided), number of Primary Care Providers, MDs, and skilled nursing facilities in county, county population, and county median per capita income; *p<0.10, **p<0.05; ***p<0.01, ****p<0.001

