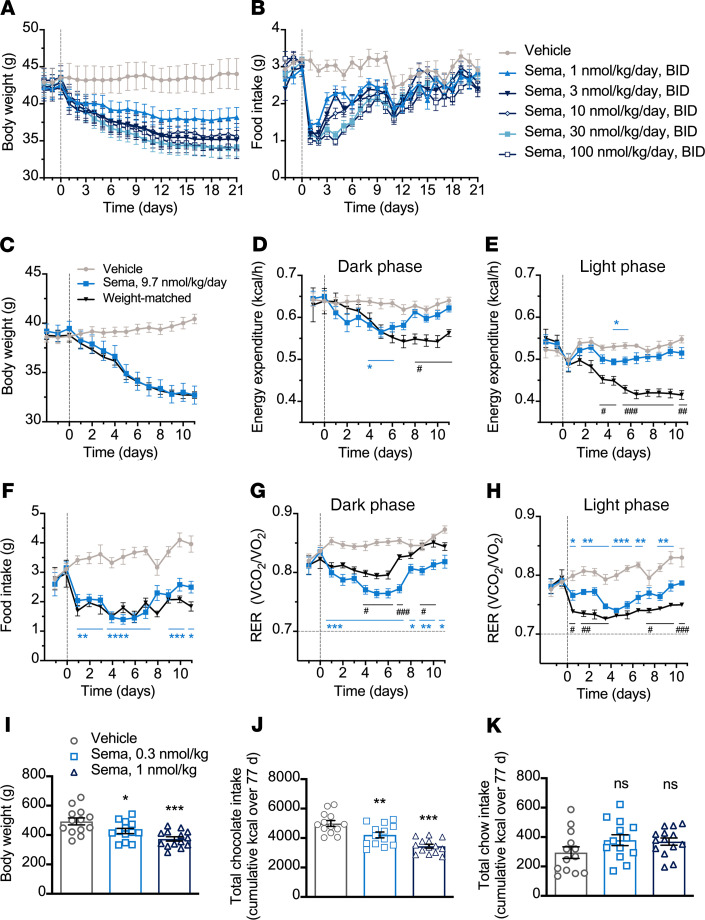
Figure 1. Semaglutide in obese rodents.
(A and B) BW and food intake in DIO mice treated twice daily (n = 9). (C−H) BW, EE, food intake, and RER in DIO mice treated once daily (n = 8). *P < 0.05, **P < 0.01, ***P < 0.001, and ****P < 0.0001 semaglutide (sema) vs. vehicle and #P < 0.05, ##P < 0.01, and ###P < 0.001 sema vs. weight-matched, mixed-effects model, Tukey’s post hoc. (I−K) BW and food preference in DIO rats treated once daily (n = 13–14). *P < 0.05, **P < 0.01, and ***P < 0.001 vs. vehicle, 1-way ANOVA, Dunnett’s post hoc. Data are individual measures with mean ± SEM. Animals were subject to a 12-hour light/12-hour dark cycle. RER, respiratory exchange ratio; sema, semaglutide.

