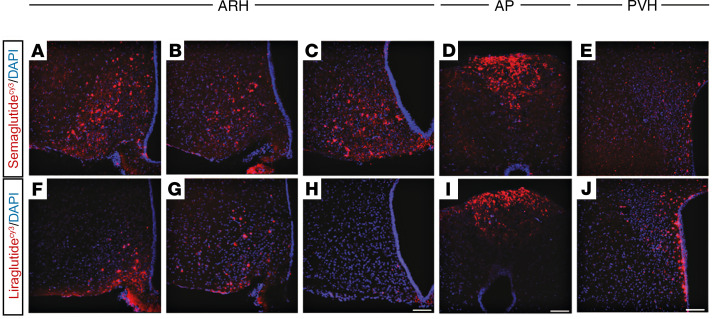
Figure 3. Differential distribution of semaglutideCy3 and liraglutideCy3 in the hypothalamus and AP.
Representative high-magnification confocal images from mice injected for 4 consecutive days with semaglutideCy3 or liraglutideCy3 (red, each n = 3); DAPI nuclear stain (blue). (A–C and F–H) ARH, 3 different levels from an anterior to posterior direction; (D and I) AP; and (E and J) PVH. Scale bar: 100 μm.

