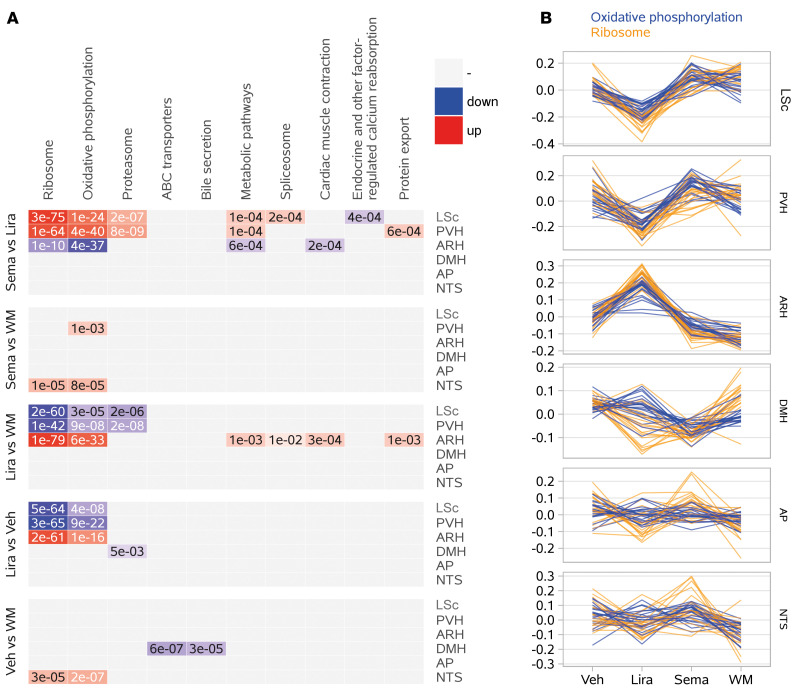
Figure 7. Transcriptomic effects across brain regions directly targeted by peripherally administered semaglutide and liraglutide.
(A) Top 10 KEGG pathways identified as overrepresented among DEGs (http://www.genome.jp/kegg/pathway.html). (B) Line charts of the 2 most highly concordant expression patterns among the DEGs shown in panel A: oxidative phosphorylation (blue) and ribosomal signaling (orange). Each line represents the relative expression of a single gene (median-centered, variance-stabilized expression count across samples for a given tissue/treatment). ABC, ATP-binding cassette; WM, weight matched.

