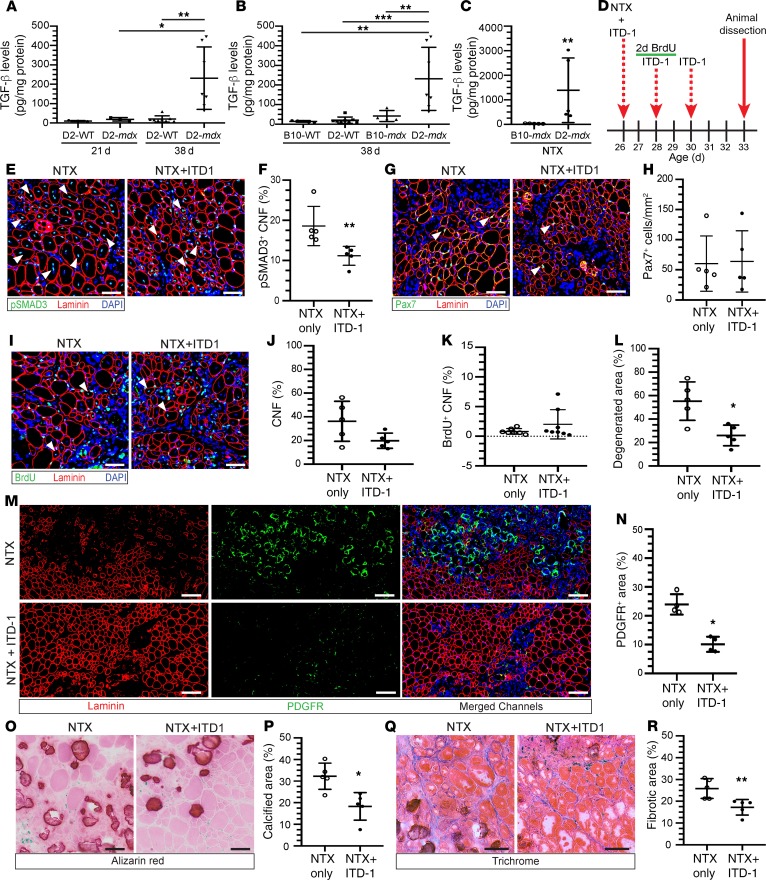
Figure 6. Inhibition of TGF-β activity attenuates degeneration and fibro-calcification in D2-mdx muscle.
(A and B) Active levels of TGF-β in muscle homogenates from 21-day-old D2-WT (n = 3) and D2-mdx (n = 3), 38-day-old D2-WT (n = 8) and D2-mdx (n = 7), and 38-day-old B10-WT (n = 5), D2-WT (n = 8), B10-mdx (n = 4), and D2-mdx (n = 7) mice. (C) Active levels of TGF-β in muscle homogenates from NTX-injured TAs (injury at 24 days of age) from B10-mdx (n = 5) and D2-mdx (n = 5) mice at 5 and 6 days postinjury. (D) TA muscles from 26-day-old D2-mdx mice received an IM injection of NTX alone or NTX plus ITD-1. At 2 and 4 days postinjury, muscles were injected with either saline or ITD-1 (BrdU administered between 24 and 72 hours postinjury). (E and F) IF images and quantification of p-SMAD3+ CNFs in muscles injured with (n = 5) or without ITD-1 (n = 5). Arrowheads, p-SMAD3+ cells. (G and H) IF images and quantification of total number of Pax7+ cells per area in muscles injured with (n = 5) or without ITD-1 (n = 5). Arrowheads, Pax7+ cells. (I–K) IF images and percentage of CNFs and BrdU+ CNFs in muscles injured with (n = 5) or without ITD-1 (n = 5). Arrowheads, BrdU+ cells. (L) Quantification of the total area of degeneration relative to total muscle cross section in muscles injured with (n = 5) or without ITD-1 (n = 5). (M and N) IF images and quantification of PDGFRα+ areas per muscle area in muscles injured with (n = 4) or without ITD-1 (n = 4). (O–R) Alizarin red and trichrome staining and quantification of muscles injured with (n = 5) or without ITD-1 (n = 5). For A and B, *P < 0.05, **P < 0.01, and ***P < 0.001; 1-way ANOVA with Tukey’s post hoc comparison; for C, F, L, N, P, and R, *P < 0.05, **P < 0.01; 2-tailed, nonparametric Mann-Whitney U test. Scale bars: 50 μm (E, G, I, O, and Q), 100 μm (M).

