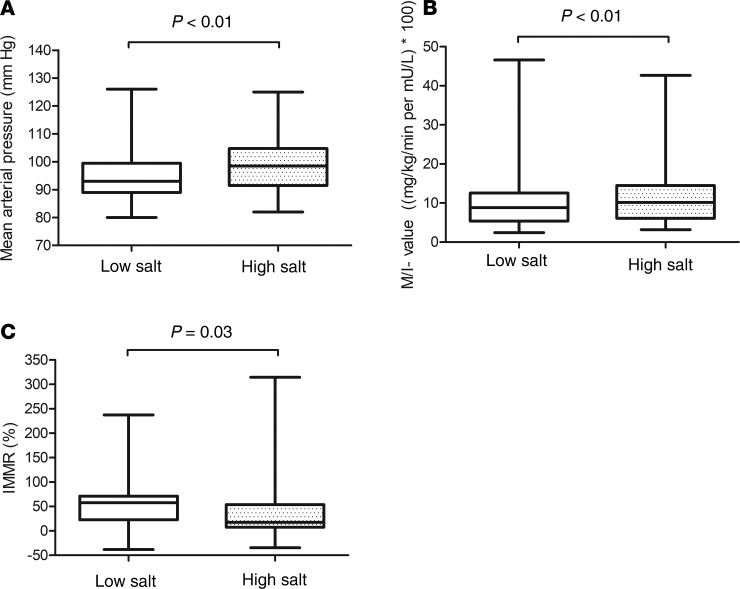
Figure 2. MAP, M/I value, and IMMR on a low-salt, as compared with a high-salt, diet in the total study population.
(A) MAP: low salt: n = 40 (20 lean and 20 abdominally obese individuals) vs. high salt: n = 40 (20 lean and 20 abdominally obese individuals. (B) M/I value: low salt: n = 39 (19 lean; no insulin levels available in 1 participant and 20 abdominally obese individuals) vs. high salt: n = 40 (20 lean and 20 abdominally obese individuals). (C) IMMR: low salt: n = 40 (20 lean and 20 abdominally obese individuals) vs. high salt: n = 39 (20 lean and 19 abdominally obese individuals; IMMR data unavailable in 1 participant). MAP was assessed with 24-hour ambulatory blood pressure measurement (ABPM), M/I value with a hyperinsulinemic-euglycemic clamp, and IMMR with contrast-enhanced ultrasound before and during hyperinsulinemia, on both a low-salt (50 mmol/24 h) and high-salt (250 mmol/24 h) diet during 7 days in randomized order. Data are presented as median (black line), first and third quartiles (box edges), and minimum and maximum (whiskers). Data were analyzed with repeated-measures ANCOVA, adjusted for group, age, and sex.

