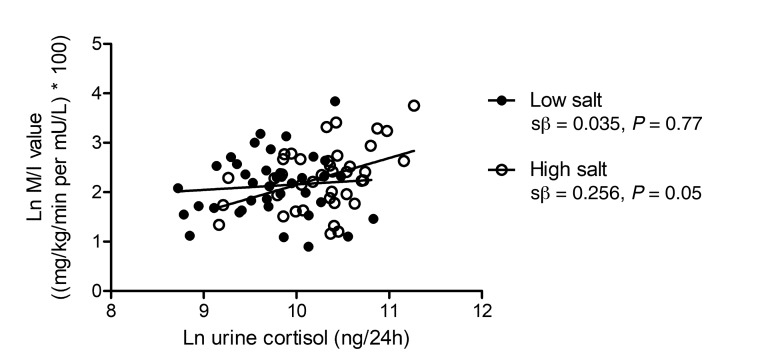
Figure 4. Association of Ln urine cortisol with Ln M/I value on a low- and a high-salt diet.
Standardized regression coefficients (derived from multiple linear regression analyses) are adjusted for group (lean/obese), age, and sex. Low salt (●): n = 39; high salt (○): n = 40. Urinary cortisol excretion was measured by supported liquid extraction (SLE+) followed by liquid chromatography tandem mass spectrometry detection (LC-MS/MS), and M/I value was assessed with a hyperinsulinemic-euglycemic clamp, on both a low-salt (50 mmol/24 h) and high-salt (250 mmol/24 h) diet during 7 days in randomized order.

