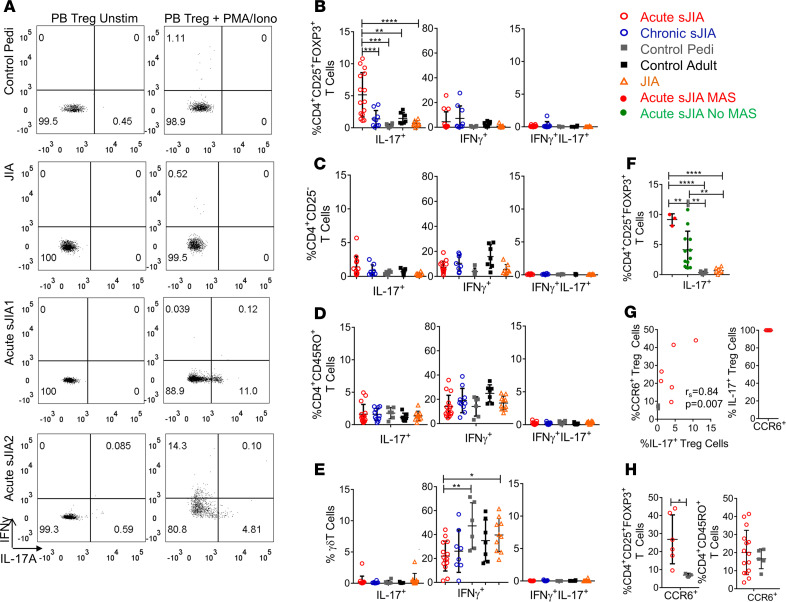
Figure 3. Acute sJIA Tregs express IL-17 to a greater degree than other T cell subsets.
(A) Representative flow cytometry dot plots gated on Tregs (CD4+CD25+FOXP3+). (B–E) The mean percentage ± SD of IL-17+, IFN-γ+, and IL-17+IFN-γ+ Tregs (CD4+CD25+FOXP3+) (B), Teffs (CD4+CD25–) (C), CD4+ memory T cells (D), and γδ T cells (E) in the peripheral blood (PB) of acute sJIA (n = 15), chronic sJIA (n = 9), pediatric control (n = 6), adult control (n = 7), and nonsystemic JIA (n = 10) study subjects as assessed by flow cytometry (1- way ANOVA corrected for multiple comparisons, *P ≤ 0.05, **P ≤ 0.01, ***P ≤ 0.001; ****P ≤ 0.0001). (F) The mean percentage ± SD of IL-17+ Tregs in the PB of acute sJIA patients with (n = 3) and without MAS (n = 12), along with pediatric controls (n = 6) and patients with nonsystemic JIA (n = 10) (1-way ANOVA corrected for multiple comparisons, **P ≤ 0.01; ****P ≤ 0.0001). (G) The correlation between the proportion of CCR6+ and IL-17A+ PB Tregs in acute sJIA patients (n = 6) and healthy controls (n = 3) measured by Spearman’s correlation coefficient. The frequency of CCR6+ cells within IL-17+ Tregs in the PB of acute sJIA patients (n = 6) as assessed by flow cytometry. (H) The mean percentage +SD of CCR6+ Tregs (acute sJIA, n = 6; pediatric control, n = 3) and CD4+ memory T cells (acute sJIA, n = 15; pediatric control, n = 6) in the PB as assessed by flow cytometry (Mann Whitney U test, P = 0.02). Pedi, pediatric; JIA, juvenile idiopathic arthritis; sJIA, systemic juvenile idiopathic arthritis; unstim, unstimulated; MAS, macrophage activation syndrome.

