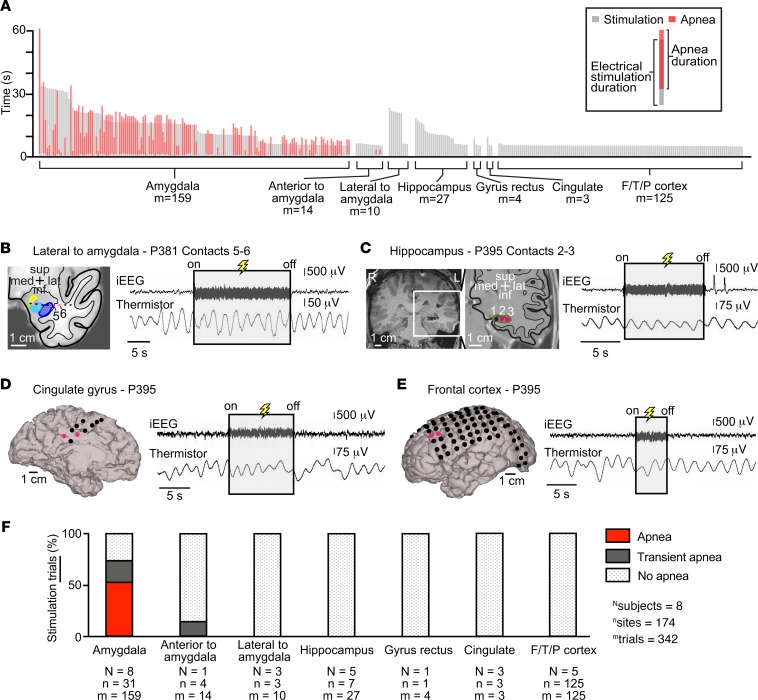
Figure 4. Stimulation-induced apnea was relatively specific to the amygdala and not seen with stimulation of any other forebrain site.
(A) Plot illustrating durations of stimulation and durations of apnea for each trial, shown by gray and red vertical lines, respectively. All trials of stimulation were at least 5 seconds in duration. Stimulation always induced apnea within 1.9 seconds after onset. Apnea was only observed with stimulation of the amygdala. (B) Location of electrode contacts superimposed upon an anatomic diagram of P381’s left temporal lobe with amygdala nuclei and surrounding areas in coronal plane. Amygdala nuclei defined as in Figure 1B. Stimulation outside and immediately lateral to the amygdala (contacts 5 and 6, pink) failed to elicit apnea. (C) Coronal T1-weighted structural MR image showing the left hippocampus depth electrode in subject P395. Electrode contacts from most medial to lateral are labeled 1–3. Location of electrode contacts superimposed upon an anatomic diagram of the left temporal lobe with hippocampus and surrounding areas in coronal plane. Stimulation of the hippocampus (contacts 2 and 3, pink) failed to elicit apnea. (D) 3D surface-rendered MR image of P395’s left medial hemisphere with superimposed electrode contacts in P395. Stimulation of the cingulate gyrus (pink circles) failed to elicit apnea. (E) 3D surface-rendered MR image of P395’s left convexity with superimposed electrode contacts. Stimulation of the left frontal cortex (pink circles) failed to elicit apnea. (F) Bar graph illustrating the percentage of trials eliciting each of the 3 types of breathing effects (apnea, red; transient apnea, dark gray; no apnea, dot shading) for all patients. Beneath each bar are the number of subjects (N), number of sites stimulated (n), and number of trials (m). Except for 1 electrode pair immediately anterior to the amygdala where stimulation led to transient apnea, stimulation at all other sites and all other trials failed to induce any measurable changes in breathing.

