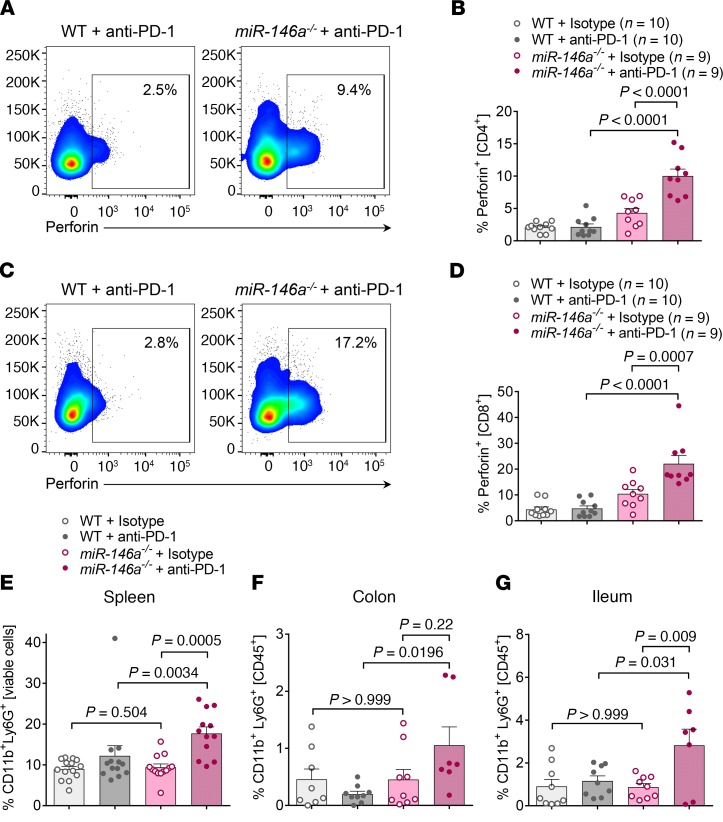
Figure 3. T cell effector function and neutrophil recruitment are regulated by miR-146a during irAE development.
(A–D) WT or miR-146a–/– mice (n = 9–10 per group) were treated with LPS and anti–PD-1/isotype control antibody as indicated and splenocytes assessed by flow cytometry on day 22. Statistical significance was analyzed by 1-way ANOVA followed by Tukey’s post hoc test. (A) Representative flow cytometry plots showing intracellular perforin staining gated on CD4+ T cells. (B) Pooled data from 2 independent in vivo experiments. (C) Representative flow cytometry plots showing intracellular perforin staining gated on CD8+ T cells. (D) Pooled data from 2 independent in vivo experiments. (E) Pooled spleen cell data from 3 independent experiments (n = 12–14 per group). Statistical significance was analyzed by Kruskal-Wallis test followed by 2-stage linear step-up procedure of Benjamini, Krieger, and Yekutieli. (F and G) WT or miR-146a–/– mice (n = 7–9 per group) were treated with LPS and anti–PD-1/isotype control antibody as indicated. Colon and ileum were isolated and digested on day 22. CD11b+Ly6G+ neutrophils were analyzed by flow cytometry. Data were from 2 independent experiments. Statistical significance was analyzed by 1-way ANOVA followed by Tukey’s post hoc test. miR-146a, microRNA-146a, irAE, immune-related adverse event, PD-1, programmed cell death protein-1.

