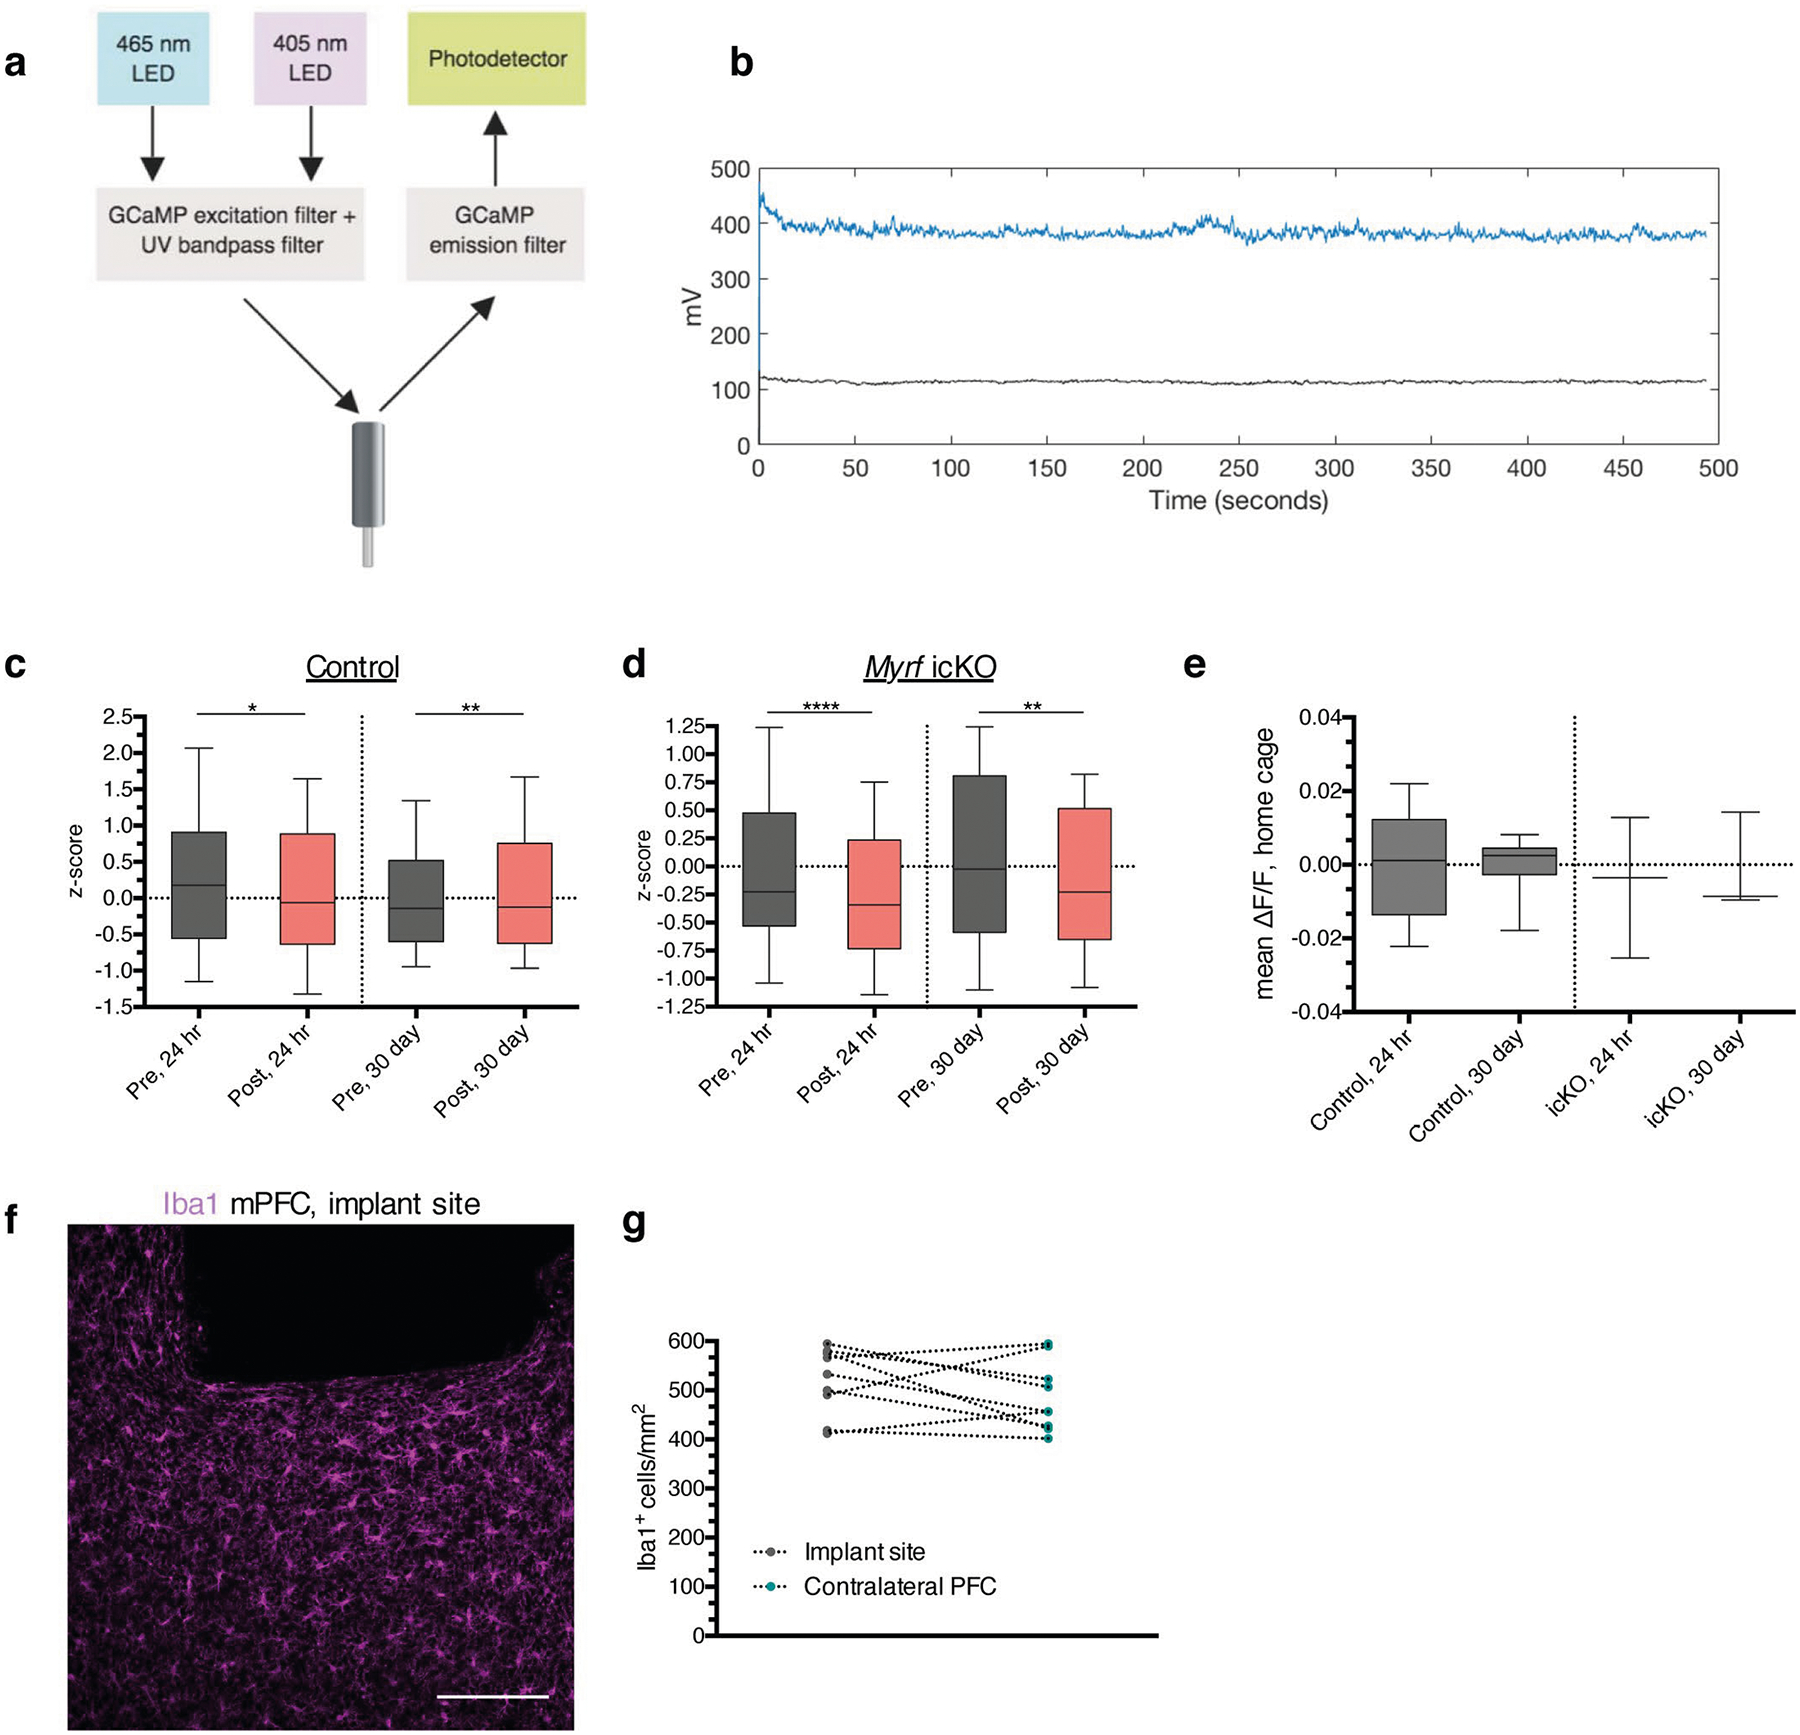
Extended Data Fig. 5 |. Supplementary data for fiber photometry experiments.

a, Schematic of fiber photometry recording setup. b, Representative trace of a recorded retrieval session depicting the raw GCaMP (blue) and isobestic (black) signal, with no detectable motion artifact. Quantification of the z-scored mean ΔF/F during the two seconds pre- and post-bout transition at 24 hours and 30 days for control (c) and Myrf icKO (d) animals; n = 10 bouts across 7 mice (controls) and 7 mice (Myrf icKO); paired two-tailed t-tests comparing z-scored signal intensity pre- and post-bout for control 24 hour (difference: −0.2016 ± 0.1564, 95% CI: −0.5095 to 0.1064, t138 = 1.289, p = 0.0202), control 30 day (difference 0.1051 ± 0.1118, 95% CI: −0.1150 to 0.3251, t138 = 0.9396, p = 0.055), Myrf icKO 24 hour (difference: −0.2216 ± 0.1650, 95% CI: −0.5494 to 0.1063, t138 = 1.343, p < 0.0001), and Myrf icKO 30 day (difference: −0.1837 ± 0.1502, 95% CI: −0.4810 to 0.1136, t138 = 1.223, p = 0.0032). e, Quantification of the mean ΔF/F over a five-minute home cage recording taken just prior to the 24-hour and 30-day retrieval sessions; n = 7 (controls) and 7 mice (Myrf icKO); unpaired two-tailed t-tests, 24 hour (difference: −0.0001284 ± 0.006472, 95% CI: −0.01423 to 0.01397, t13 = 0.01984, p = 0.6534), 30 day (difference: 0.004054 ± 0.01353, 95% CI: −0.03350 to 0.04161, t13 = 0.9334, p = 0.8892). f, Representative image of Iba1 staining under the implant site, quantified in (g); paired two-tailed t-test (difference: −32.40 ± 26.10, 95% CI: −92.58 to 27.78, t16 = 0.908, p = 0.2496), n = 9 mice. Scale bar: 100 μm. For box-and-whisker plots, the center, boxes, and whiskers represent the median, interquartile range, and the 10th and 90th percentiles, with asterisks indicating the following p-value ranges: * ≤ 0.05, ** ≤ 0.01, **** ≤ 0.0001.
