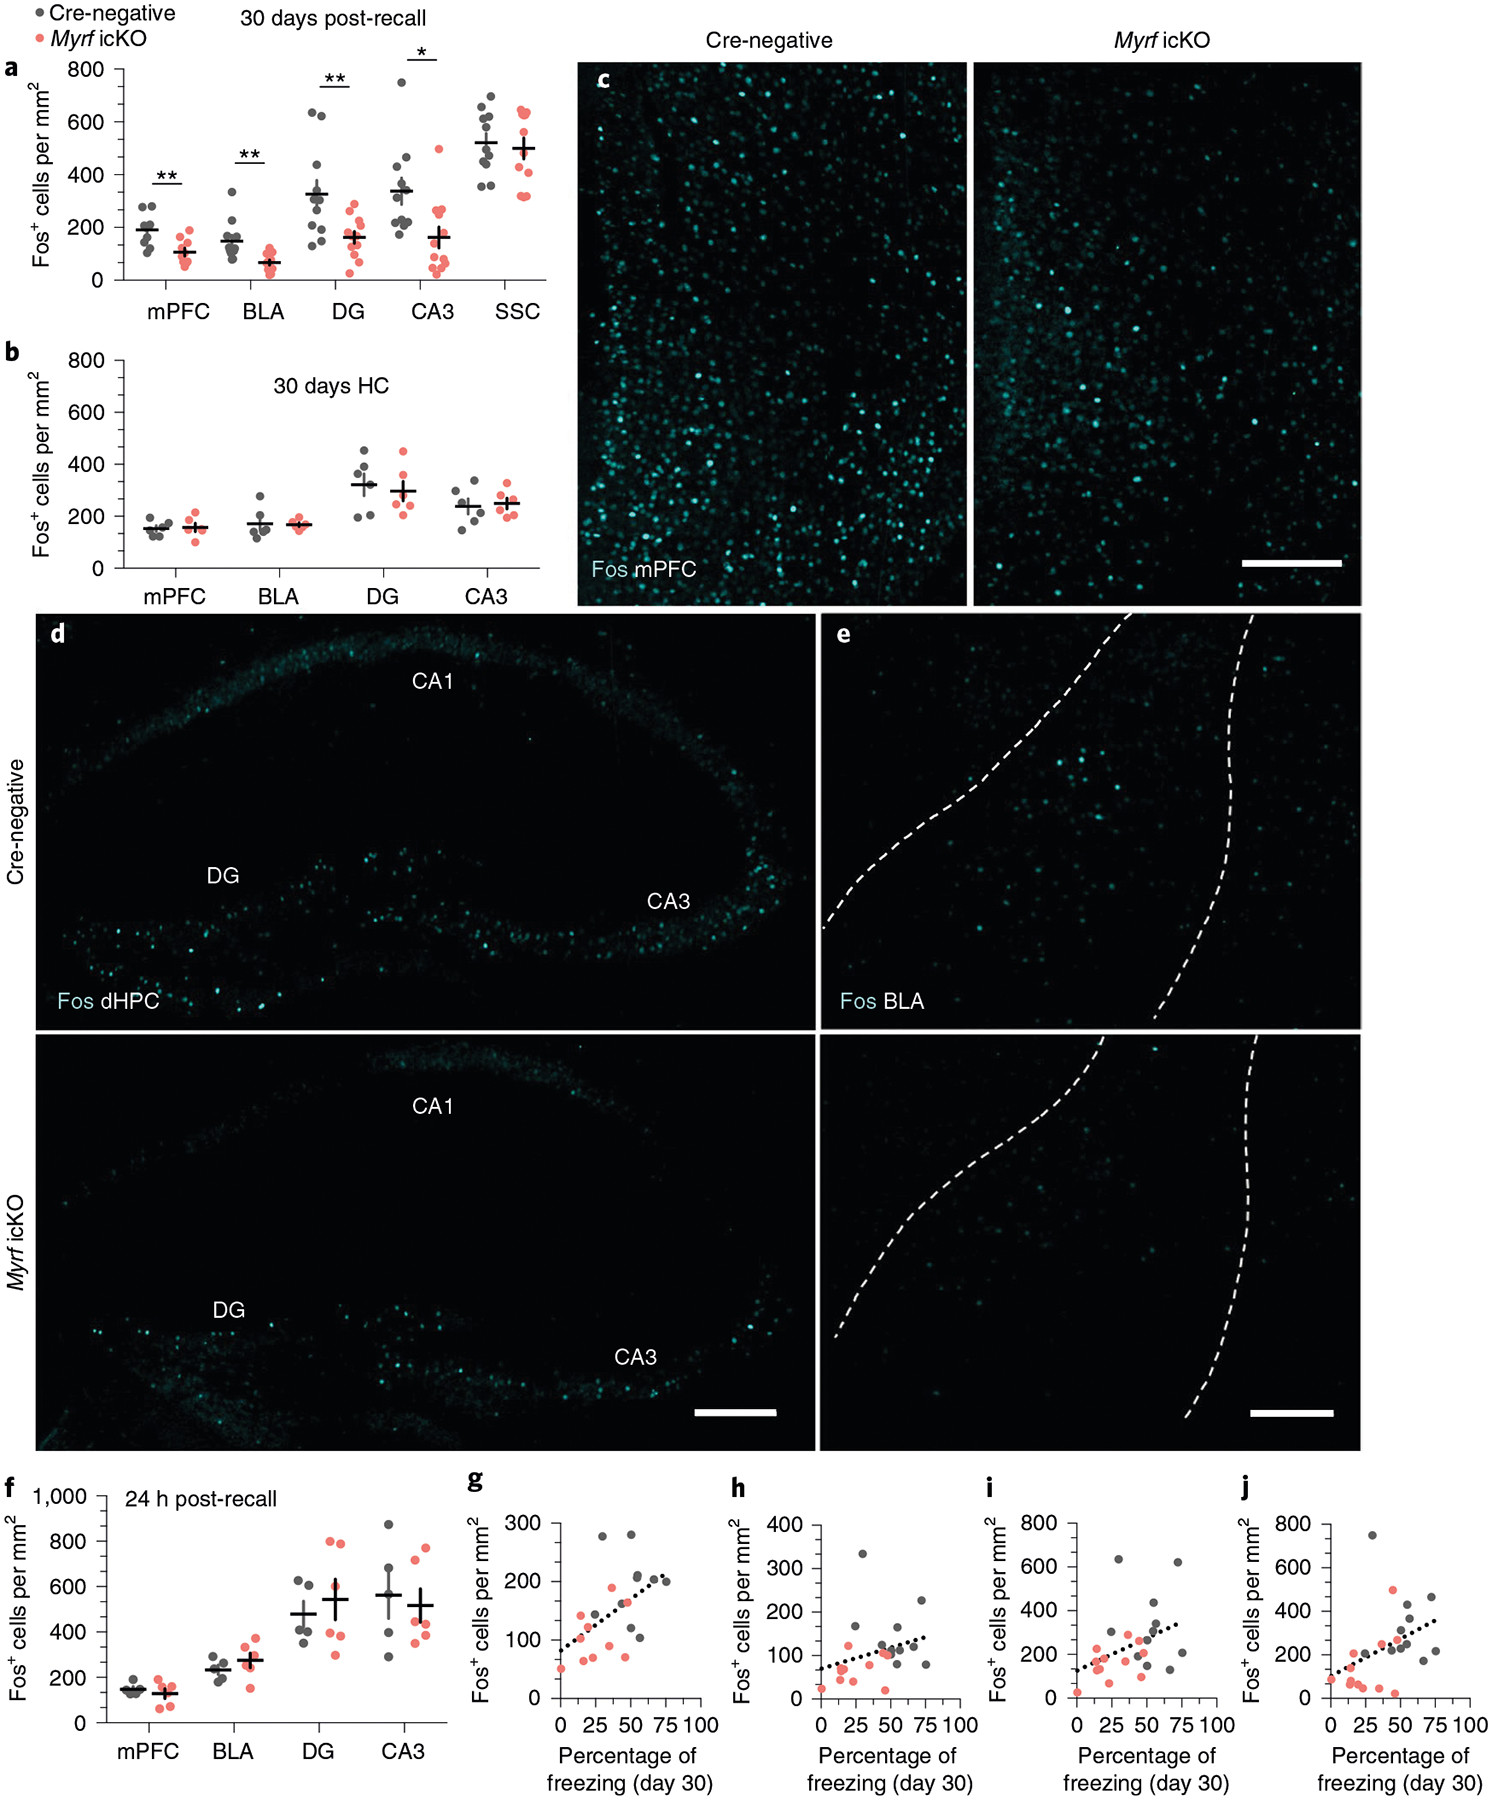
Fig. 5 |. immediate early gene expression following remote recall is impaired in the absence of new myelin formation.

a, Quantification of Fos+ cell density across brain regions following 30-day retrieval sessions in Myrf icKO versus Cre-negative controls (the key to the chart also applies to b,f–j). Unpaired two-tailed t-tests, mPFC (difference: 84.27 ± 23.89; 95% CI: −34.09 to 134.5; t21 = 3.528, P = 0.0024), BLA (difference: 80.55 ± 24.87; 95% CI: 28.66 to 132.4; t21 = 3.238, P = 0.0041), DG (difference: 163.5 ± 55.29, 95% CI: 48.50 to 278.5, t21 = 2.957, P = 0.0075), CA3 (difference: 175.4 ± 63.83; 95% CI: 42.70 to 308.2; t21 = 2.749, P = 0.012), SSC (difference: 21.86 ± 53.48; 95% CI: −89.35 to 133.1; t21 = 0.4088, P = 0.6868), n = 12 Cre-negative and 11 Myrf icKO mice. b, Quantification of baseline HC Fos+ cell density across brain regions in Myrf icKO versus Cre-negative controls. Unpaired two-tailed t-tests, mPFC (difference: 4.591 ± 19.85; 95% CI: −39.64 to 48.82; t10 = 0.2313, P = 0.8218), BLA (difference: −3.475 ± 25.49; 95% CI: −60.28 to 53.33; t10 = 0.1363, P = 0.8943), DG (difference: −24.73 ± 56.36; 95% CI: −150.3 to 100.8; t10 = 0.4387, P = 0.6702), CA3 (difference: 11.42 ± 36.00; 95% CI: −68.79 to 91.63; t10 = 0.3172, P = 0.7576), n = 6 mice per genotype. c–e, Representative images of Fos induction (cyan) in the mPFC (c), dHPC (d) and BLA (e, outlined in dashed lines) of Cre-negative and Myrf icKO animals following 30-day retrieval. f, Quantification of Fos+ density across brain regions following 24-h retrieval sessions. Unpaired two-tailed t-tests, mPFC (difference: −18.95 ± 25.61; 95% CI: −76.90 to 38.99; t9 = 0.74, P = 0.4781), BLA (difference: 41.33 ± 39.72; 95% CI: −48.53 to 131.2; t9 = 1.041, P = 0.3252), DG (difference: 64.80 ± 111.0; 95% CI: −186.2 to 315.8; t9 = 0.5839, P = 0.5736), CA3 (difference: −45.58 ± 123.5; 95% CI: −324.9 to 233.7; t9 = 0.3692, P = 0.7205), n = 5 Cre-negative and 6 Myrf icKO mice. g–j, Individual 30-day freezing responses plotted against Fos+ cell density in the mPFC (g), the BLA (h), the DG (i) and the CA3 (j). Two-tailed Spearman’s correlation test, mPFC (Rs = 0.589; 95% CI: 0.1853 to 0.8231; P = 0.0062), BLA (Rs = 0.467; 95% CI: 0.04322 to 0.7483; P = 0.0284), DG (Rs = 0.451; 95% CI: 0.03545 to 0.7343; P = 0.305), CA3 (Rs = 0.535; 95% CI: 0.1449 to 0.7812; P = 0.0085), n = 23 mice. Scale bars, 200 μm (c–e). Data are presented as the mean ± s.e.m. *P ≤ 0.05, **P ≤ 0.01.
