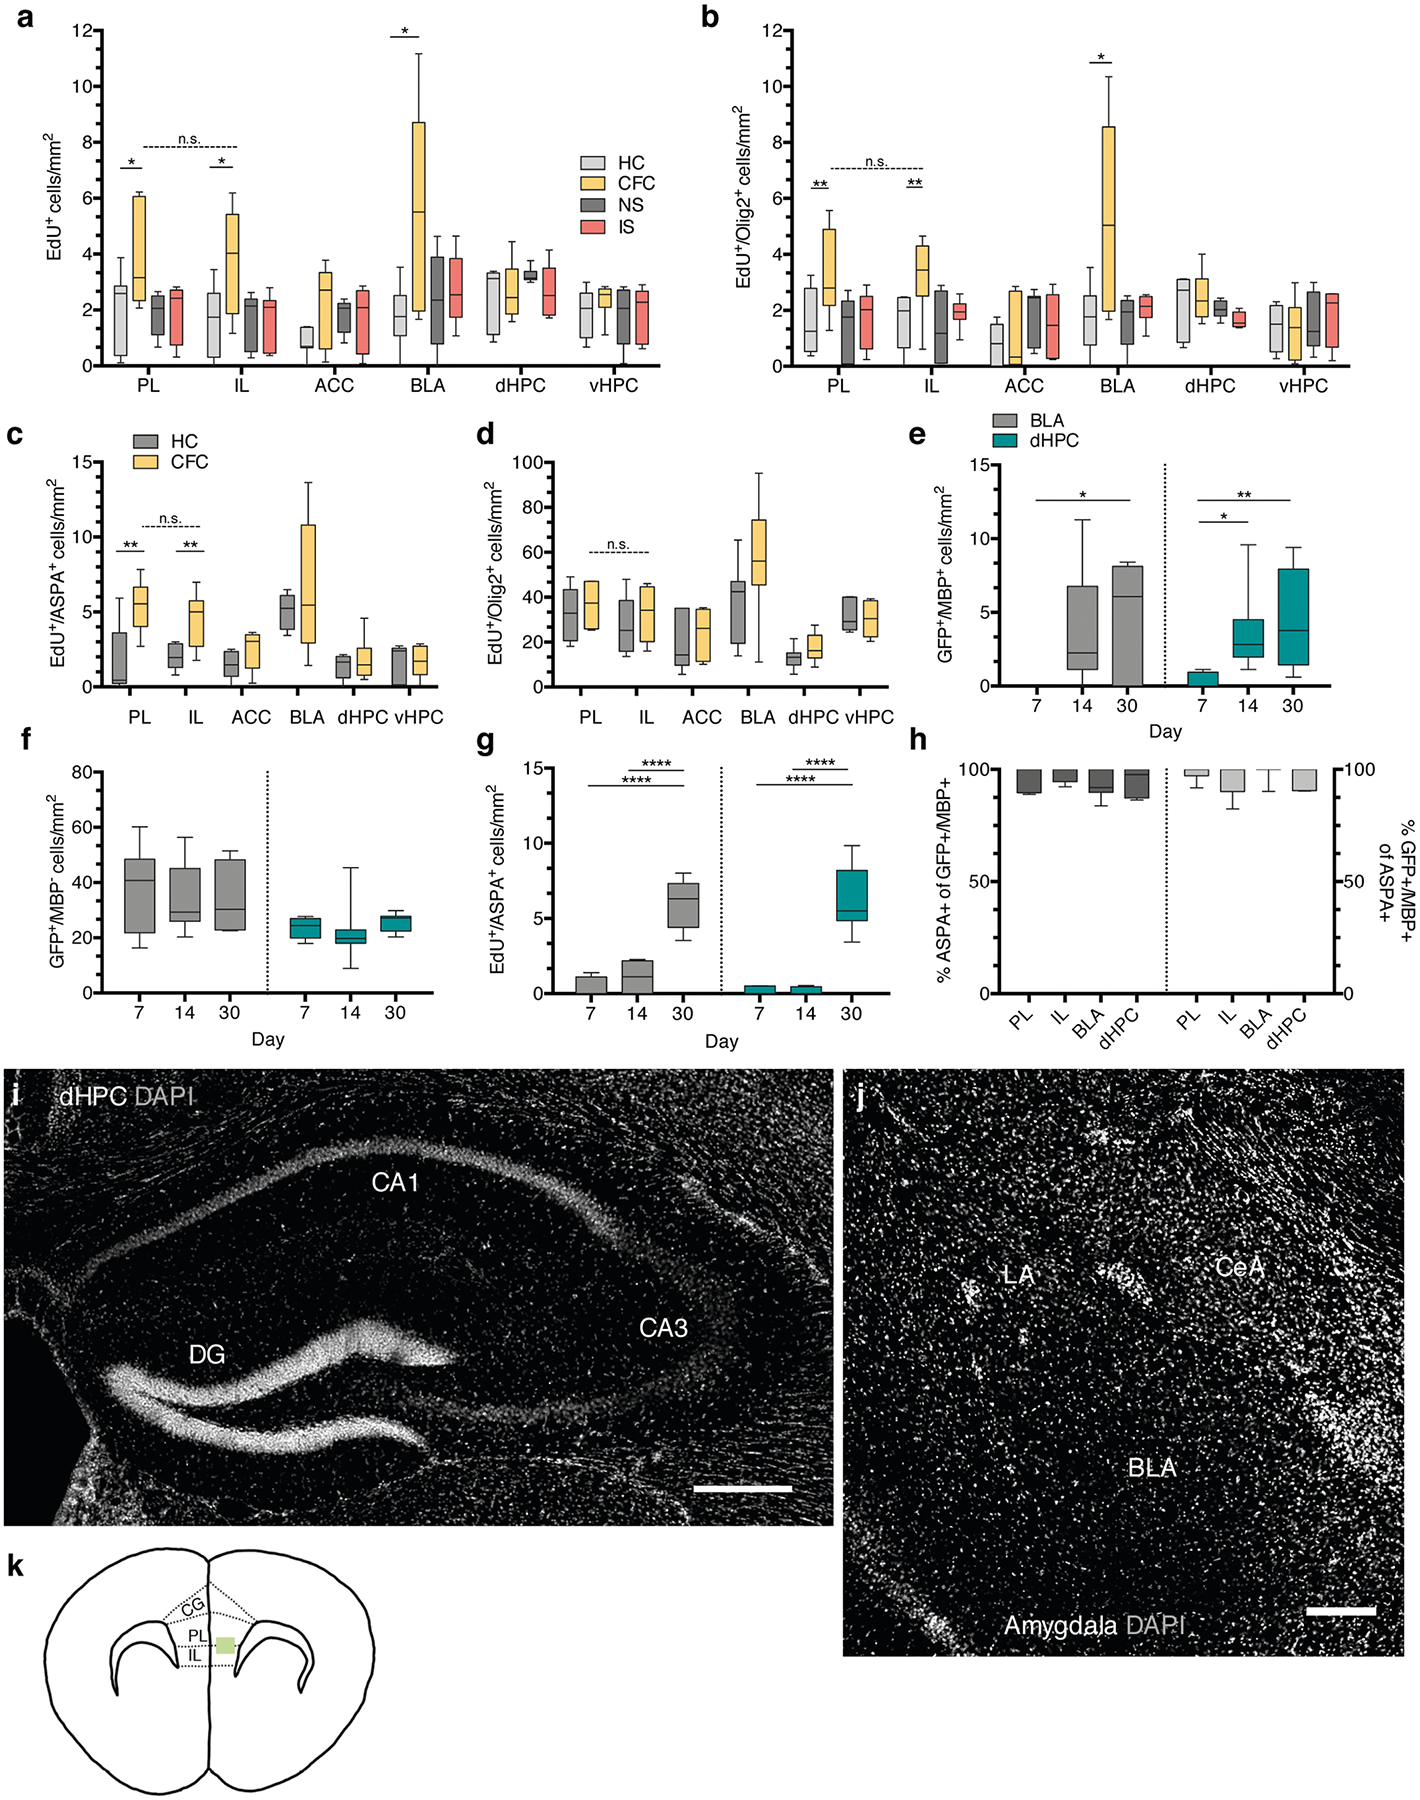
Extended Data Fig. 1 |. Proliferation, differentiation, and maturation of oPCs following fear learning.

a, EdU+ cell density of home cage (HC), fear conditioned (CFC), no shock (NS), and immediate shock (IS) animals 24 hours post-conditioning; unpaired two-tailed t-tests comparing HC vs. CFC for PL (difference: 2.060 ± 0.8565, 95% CI: 0.1942 to 3.927, t12 = 2.406, p = 0.0332), IL (difference: 2.239 ± 0.8566, 95% CI: 0.3731 to 4.106, t12 = 2.614, p = 0.0226), ACC (difference: 1.176 ± 0.5811, 95% CI: −0.09067 to 2.442, t12 = 2.406, p = 0.0760), BLA (difference: 3.865 ± 1.395, 95% CI: 0.8506 to 6.880, t12 = 2.77, p = 0.0159), dHPC (difference: 2.060 ± 0.8565, 95% CI: 0.1942 to 3.927, t12 = 2.406, p = 0.6694), vHPC (difference: 0.2300 ± 0.5265, 95% CI: −0.9075 to 1.368, t12 = 0.4369, p = 0.3128), paired two-tailed t-test comparing PL vs. IL for CFC animals (difference: −0.1025 ± 0.7635, 95% CI: −1.971 to 1.766, t6 = 0.1343, p = 0.8975). b, EdU+/Olig2+ cell density at 24 hours post-conditioning; unpaired two-tailed t-tests comparing HC vs. CFC for PL (difference: 1.801 ± 0.7408, 95% CI: 0.1867 to 3.415, t12 = 2.431, p = 0.0317), IL (difference: 1.547 ± 0.6297, 95% CI: 0.1750 to 2.919, t12 = 2.457, p = 0.0302), ACC (difference: 0.2161 ± 0.5518, 95% CI: −0.9863 to 1.418, t12 = 0.3916, p = 0.7022), BLA (difference: 3.619 ± 1.338, 95% CI: 0.7295 to 6.509, t12 = 2.706, p = 0.018), dHPC (difference: 0.2882 ± 0.4868, 95% CI: −0.7634 to 1.340, t12 = 0.592, p = 0.564), vHPC (difference: −0.008014 ± 0.5297, 95% CI: −1.162 to 1.146, t12 = 0.01513, p = 0.9882), paired two-tailed t-test comparing PL vs. IL for CFC animals (difference: −0.2322 ± 0.4552, 95% CI: −1.346 to 0.8817, t12 = 0.5102, p = 0.6289). For (a-b), n = 7 mice (HC), 8 mice (CFC), 7 mice (NS), 8 mice (IS). c, EdU+/ASPA+ density post-conditioning; unpaired two-tailed t-tests HC vs. CFC for PL (difference: 3.576 ± 1.006, 95% CI: 1.404 to 5.749, t13 = 3.556, p = 0.035), IL (difference: 2.472 ± 0.7097, 95% CI: 0.9503 to 3.995, t13 = 0.5102, p = 0.037), ACC (difference 0.9596 ± 0.5516, 95% CI: −0.2234 to 2.143, t13 = 0.5102, p = 0.1038), BLA (difference: 1.520 ± 2.071, 95% CI: −3.165 to 6.204, t13 = 0.7339, p = 0.4817), dHPC (difference: 0.3704 ± 0.5950, 95% CI: −0.9150 to 1.656, t13 = 0.6225, p = 0.5444), vHPC (difference: 0.0536 ± 0.6227, 95% CI: −1.303 to 1.410, t13 = 0.086, p = 0.9328), paired two-tailed t-test comparing PL vs. IL for CFC animals (difference: −0.9171 ± 0.7719, 95% CI: −2.742 to 0.9081, t13 = 1.188, p = 0.5466). d, EdU+/Olig2+ density 30 days post-conditioning; unpaired two-tailed t-tests HC vs. CFC for PL (difference: 4.512 ± 5.558, 95% CI: −7.599 to 16.62, t13 = 0.8117, p = 0.4328), IL (difference: 4.514 ± 6.705, 95% CI: −10.10 to 19.12, t13 = 0.6731, p = 0.5136), ACC (difference: 3.086 ± 6.324, 95% CI: −10.69 to 16.86, t13 = 0.488, p = 0.6343), BLA (difference: 19.00 ± 11.32, 95% CI: −5.452 to 43.45, t13 = 1.679, p = 0.1171), dHPC (difference: 4.325 ± 2.933, 95% CI: −2.011 to 10.66, t13 = 1.475, p = 0.1641), vHPC (difference: −0.8542 ± 3.854, 95% CI: −9.251 to 7.543, t13 = 0.2216, p = 0.8283), paired two-tailed t-test comparing PL vs. IL for CFC animals (difference: −4.630 ± 6.858, 95% CI: −21.41 to 12.15, t13 = 0.6751, p = 0.5248). For (c-d), n = 7 mice (HC) and 8 mice (CFC). Quantification of GFP+/MBP+ (e), GFP+/MBP− (f), and EdU+/ASPA+ (g) cell density in the dHPC and BLA; n = 6 mice (7 days), 9 mice (14 days), and 7 mice (30 days). e-g One-way ANOVA with Sidak’s post hoc tests comparing cell densities across days; (e) BLA: F2,19 = 4.369, p = 0.0275, 7 vs. 14 day, (difference: −3.760 ± 1.672, 95% CI: −7.818 to 0.2981, p = 0.0718), 7 vs. 30 day (difference: −5.041 ± 1.765, 95% CI: −9.324 to −0.7572, p = 0.0201), dHPC: F2,22 = 5.397, p = 0.0124, 7 vs. 14 day, (difference: −3.108 ± 1.241, 95% CI: −6.086 to −0.1300, p = 0.0399), 7 vs. 30 day (difference: −4.124 ± 1.303, 95% CI: −7.251 to −0.9968, p = 0.009); (f) BLA: F2,19 = 0.07572, p = 0.9274, 7 vs. 14 day, (difference: 2.354 ± 6.908, 95% CI: −14.41 to 19.12, p = 0.9308), 7 vs. 30 day (difference: 2.540 ± 7.292, 95% CI: −15.16 to 20.24, p = 0.9279), dHPC: F2,20 = 0.4852, p = 0.6226, 7 vs. 14 day, (difference: 1.629 ± 3.759, 95% CI: −7.456 to 10.71, p = 0.8907), 7 vs. 30 day (difference: −1.900 ± 4.049, 95% CI: −11.69 to 7.888, p = 0.8733); (g) BLA: F2,18 = 47.49, p < 0.0001, 7 vs. 14 day, (difference: −0.6155 ± 0.6763, 95% CI: −2.265 to 1.034, p = 0.6092), 7 vs. 30 day (difference: −5.632 ± 0.6565, 95% CI: −7.233 to −4.031, p < 0.0001), dHPC: F2,16 = 46.74, p < 0.0001, 7 vs. 14 day, (difference: −0.03272 ± 0.7020, 95% CI: −1.764 to 1.699, p = 0.9987), 7 vs. 30 day (difference: −6.038 ± 0.7285, 95% CI: −7.835 to −4.242, p < 0.0001). h, Proportion of GFP+/MBP+ cells that are ASPA+ (left bars) and the proportion of ASPA+/GFP+ cells that are MBP+ (right bars) at 30 days post-conditioning; n = 7 mice. Representative DAPI (gray) images the sub-regional dHPC (i) and amygdalar (j) cytoarchitecture, scale bars: 250 μm (k) Schematic of the sampled area within the mPFC (green rectangle); dashed lines demarcate the approximate region cut for electron microscopy. For box-and-whisker plots, the center, boxes, and whiskers represent the median, interquartile range, and the 10th and 90th percentiles, with asterisks indicating the following p-value ranges: * ≤ 0.05, ** ≤ 0.01, *** ≤ 0.001, **** ≤ 0.0001.
