. 2020 Apr 27;9:e55852. doi: 10.7554/eLife.55852

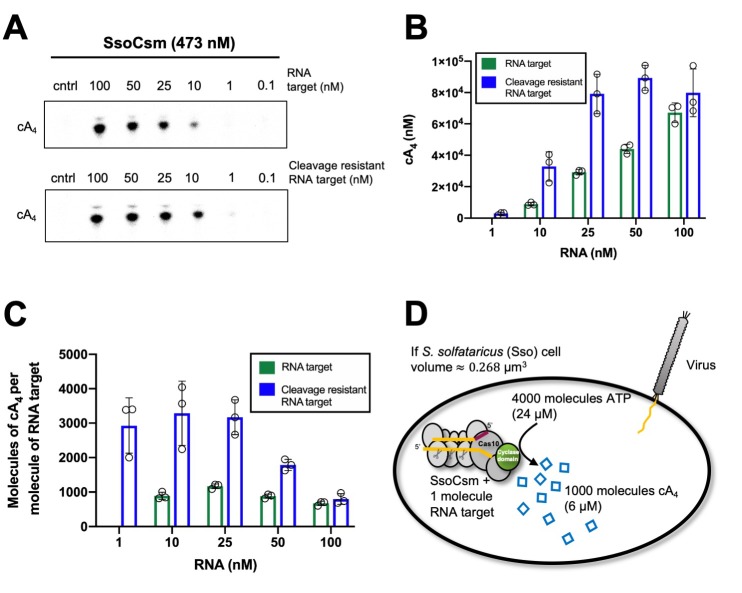
Figure 2. Approximately 1000 molecules cA4 are made per molecule of RNA target.

(A) Upper panel shows phosphorimages of thin-layer chromatography of cyclic tetra-adenylate (cA4) made by S. solfataricus (Sso) Csm complex (470 nM carrying the CRISPR RNA A26) across a range of RNA target concentrations (0.1, 1, 10, 25,100 nM) complementary to the A26 CRISPR RNA at 70°C. Lower panel shows cA4 synthesised with a cleavage resistant (phosphorothioate) form of the RNA target. (B) Bar graph of the concentration of cA4 generated with increasing cleavable and cleavage-resistant RNA target generated by quantifying the densiometric signals from A, with an α-32P-ATP standard curve (Figure 2—figure supplement 1). Error bars indicate the standard deviation of the mean of three technical replicates, with individual data points shown as clear circles. No data are shown for 1 nM cleavable RNA target as cA4 generated was below detection limits. (C) Bar chart quantifying the number of molecules of cA4 generated per molecule of cleavable or cleavage resistant target RNA across a range of RNA target concentrations. On average SsoCsm synthesised 980 ± 24 and 3100 ± 750 molecules of cA4 per molecule of cleavable and cleavage resistant target RNA, respectively. (D) Cartoon depicting the cellular implications of ~1000 molecules of cA4 generated per molecule of RNA target, which in S. solfataricus would equate to ~6 µM cA4 within the cell.

Figure 2—source data 1. Excel spreadsheet with raw data.
elife-55852-fig2-data1.xlsx (282.4KB, xlsx)

Figure 2.

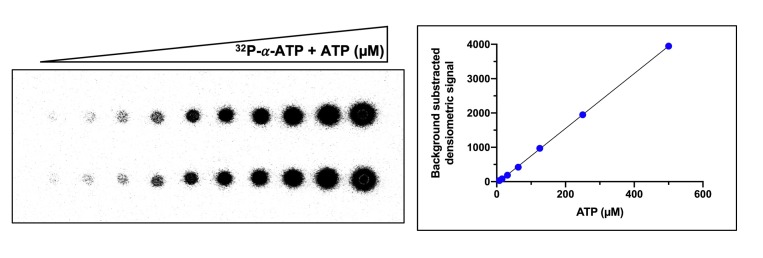
Figure 2—figure supplement 1. Example of ATP standard curve used to determine the concentration of ATP converted to cyclic tetra-adenylate (cA4).

Figure 2—figure supplement 1.

Left-hand side panel shows duplicate serial dilution of 32P-α-ATP (5 nM) and ATP (500 µM) mix spotted (1 µl) on a thin-layer chromatography (TLC) plate. The right-hand side panel is a plot of the densiometric signal quantified from the TLC plate after phosphorimaging. The mean densiometric signal is plotted and errors bars showing the standard deviation are plotted but not visible due to their scale. The densiometric signal corresponding to cA4 was compared to the standard curve to determine the concentration of ATP converted. Duplicate standard curves were carried out for each replicate assay examining cA4 synthesis.
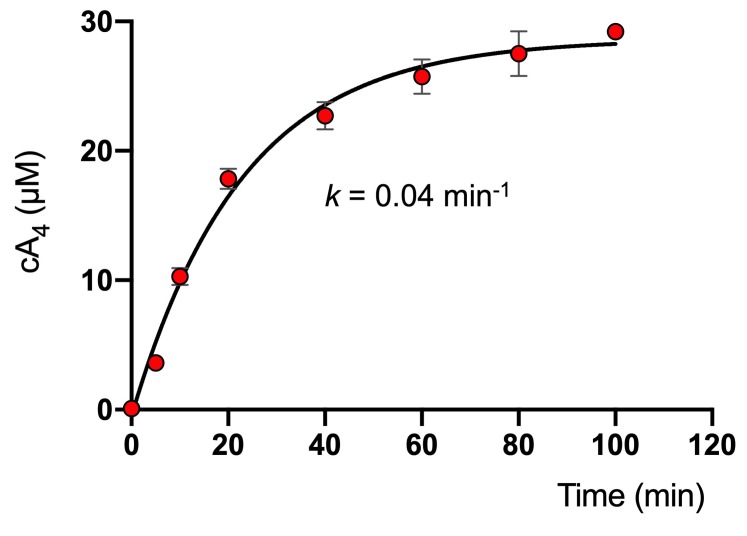
Figure 2—figure supplement 2. Rate of cA4 synthesis by S. solfataricus type III-D effector complex.

Figure 2—figure supplement 2.

Plot showing the concentration of cA4 generated by SsoCsm (~4.2 µM) over time in the presence of 25 nM RNA target, 0.5 mM ATP and 2 nM 32P-α-ATP at 70°C. The data were originally reported in Rouillon et al. (2018) and here were fitted to an exponential equation to determine the kinetic rate constant of cA4 synthesis (0.04 ± 0.01 min−1). Error bars show the standard deviation of the mean of three technical replicates.
Figure 2—figure supplement 2—source data 1. Excel speadsheet with raw data.