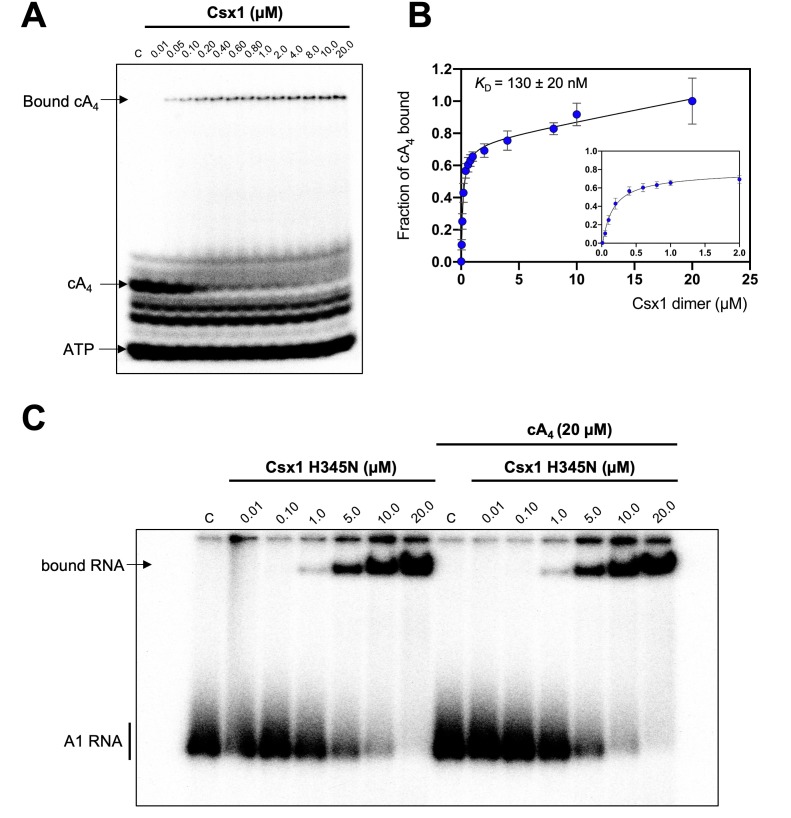
Figure 3. Csx1 binds cA4 with high affinity and RNA with relatively low affinity.
(A) Phosphorimage of native gel electrophoresis visualising cA4 (20 nM) binding by Csx1 (concentrations as indicated in the figure). The other bands visible are due to unreacted ATP and other linear nucleotide products. (B) Plot of fraction of cA4 bound by Csx1. Error bars indicate the standard deviation of the mean of four technical replicates and the data were fitted to a quadratic equation incorporating a term for non-specific binding. The inset plot is a magnification of cA4 binding between 0.01 and 5 µM Csx1 dimer concentrations. (C) Phosphorimage of native gel electrophoresis visualising A1 substrate RNA binding by Csx1 H345N protein dimer in the absence (left hand-side) or presence (right hand-side) of unlabelled cA4 (20 µM). The image shown is representative of three technical replicates. Control c – RNA alone.

