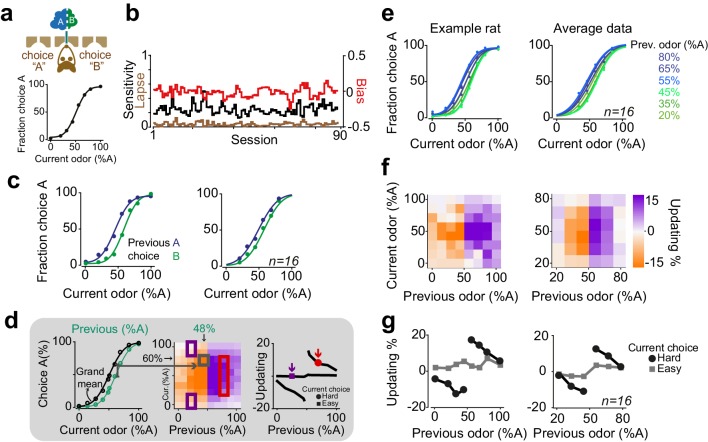
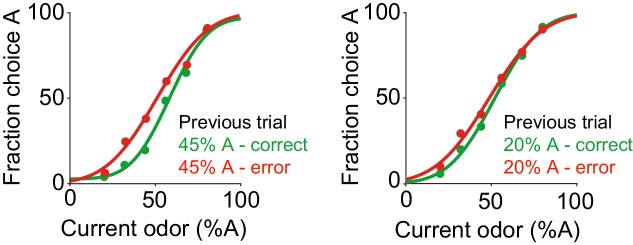
Figure 1. Rats update their trial-by-trial perceptual choice strategy in a stimulus-dependent manner.
(a) Top: Schematic of a 2AFC olfactory decision-making task for rats. Bottom) Average performance of an example rat. (b) Following learning, the psychometric curves showed minimal fluctuations across test sessions. Bias, sensitivity and lapse were measured for each test session. (c) After successful completion of a trial, rats tended to shift their choice toward the previously rewarded side. Left and right panels illustrate example animal and population average. (d) Schematic of analysis procedure for computing conditional psychometric curves and updating plots. Left: Black curve shows the overall psychometric curve and the green curve shows the curve only after trials with 48% odor A (i.e. conditional on the stimulus (48% A) in the previous trial). Middle: Each point in the heatmap indicates the vertical difference between data points of the conditional psychometric curve and the overall psychometric curve. Red and purple boxes indicate data points which are averaged to compute data points shown in the rightmost plot. Right: Updating averaged across current easy trials (in this case the easiest two stimulus levels) and current difficult trials. (e) Performance of the example rat (left) and population (right) computed separately based on the quality of olfactory stimulus (shown as colors mixtures from blue to green) in the previously rewarded trial. After successful completion of a trial, rats tended to shift their choices towards the previously rewarded side but only when the previous trial was difficult. (f) Choice updating, that is the size of shift of psychometric curve relative to the average psychometric curve, as a function of sensory evidence in the previously rewarded trial, and current trial. Positive numbers refer to a bias towards choice A and negative numbers refer to a bias toward the alternative choice. The left and right plots refer to the example rat and population, respectively. (g) Choice updating as a function of previous stimulus separated for current easy (square) and difficult (circle) trials. These plots are representing averages across graphs presented in f.


