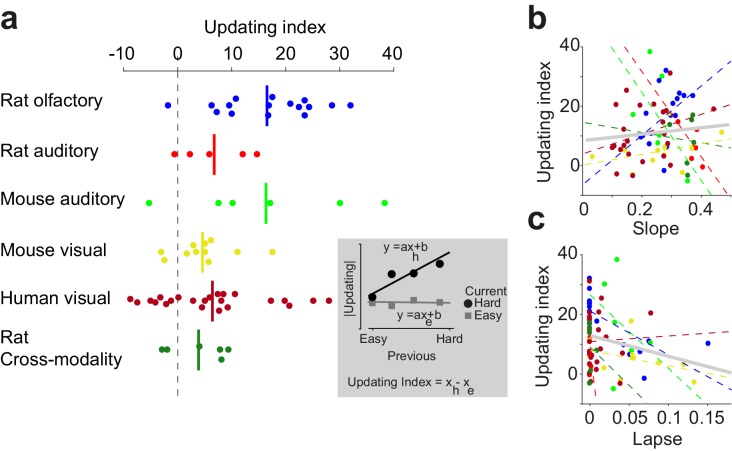
Figure 10. Confidence-guided choice updating is strongest in individuals with well-defined psychometric behavior.
(a) The strength of choice updating among individuals. The vertical lines show the mean. Inset: schematics illustrates the calculation of updating index. The index is defined as the difference in the slope of lines fitted to the data. (b) Scatter plot of choice updating as a function of the slope of psychometric curve. Each circle is one individual. Dashed lines illustrate a linear fit on each data set, and the gray solid line shows a linear fit on all subjects. (c) Scatter plot of choice updating as a function of the lapse rate of the fitted psychometric curve.

